Open Access
Fig. 4.
Download original image
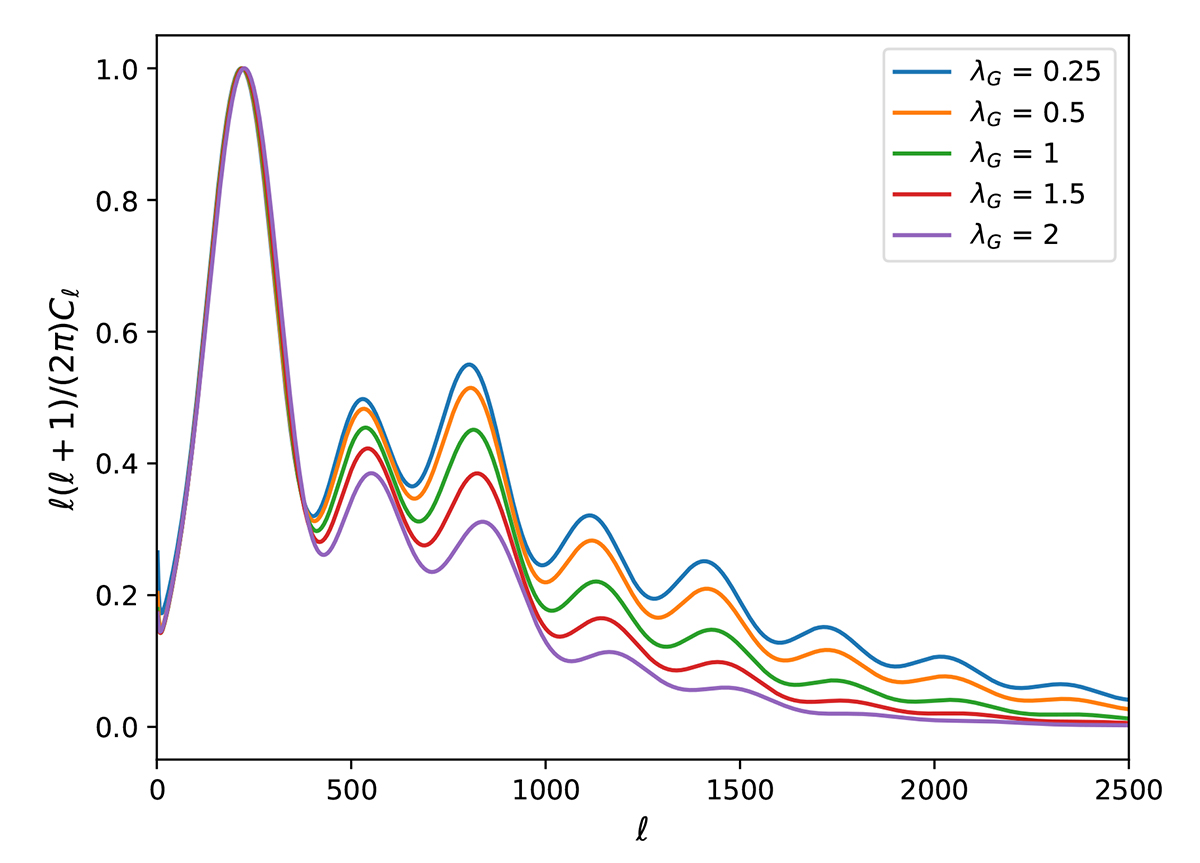
Effect of λG on the temperature power spectrum of the CMB. The first peak has been normalised (in the amplitude of the first pic) and the same physical energy densities have been used for each curve. This plot shows the increase in the damping tails with increasing λG.
Current usage metrics show cumulative count of Article Views (full-text article views including HTML views, PDF and ePub downloads, according to the available data) and Abstracts Views on Vision4Press platform.
Data correspond to usage on the plateform after 2015. The current usage metrics is available 48-96 hours after online publication and is updated daily on week days.
Initial download of the metrics may take a while.