Fig. 6.
Download original image
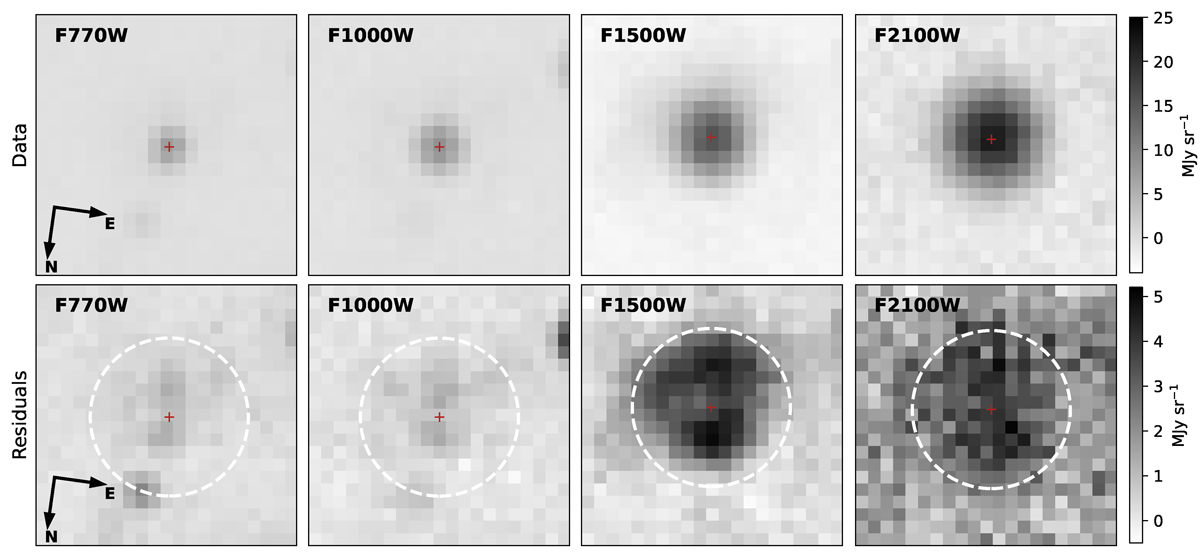
Background emission in the JWST/MIRI images of SN 1993J after removing the bright SN component. Top: Location of SN 1993J in each of the four filters of MIRI imaging. The red cross indicates the centroid of the SN in each panel obtained from our PSF-fitting photometry. We note that the photometry was performed on individual dithered exposures, but here the pixels around the SN position have been median combined for display purposes. Bottom: Background emission around the position of SN 1993J in the four MIRI filters after the removal of the bright SN source during PSF-fitting photometry. In each case, the background level immediately under the SN was determined by fitting a small box (width of five pixels). The fits were repeated with a larger box while holding the background fixed to subtract the SN PSF. As in the top row, the residual data from each dither have been median combined for display purposes, and the red cross indicates the centroid of the SN PSF. The white dashed circle is ![]() in radius from this position.
in radius from this position.
Current usage metrics show cumulative count of Article Views (full-text article views including HTML views, PDF and ePub downloads, according to the available data) and Abstracts Views on Vision4Press platform.
Data correspond to usage on the plateform after 2015. The current usage metrics is available 48-96 hours after online publication and is updated daily on week days.
Initial download of the metrics may take a while.