Fig. 5.
Download original image
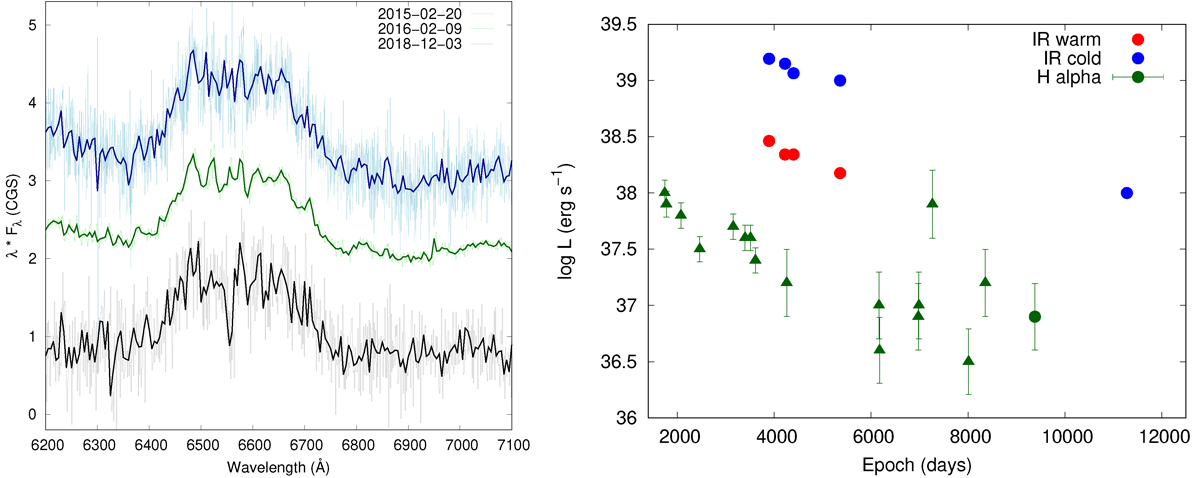
Comparison of late-time Hα and IR emission of SN 1993J. Left: Hα emission line profiles in the most recent high-resolution optical spectra of SN 1993J obtained with Keck/LRIS in 2015, 2016 (published by Smith et al. 2017), and in 2018 (this work). The dates belong to epochs 7999, 8353, and 9381 days, respectively. Spectra are vertically shifted for better comparison. Dark solid lines mark the five Å-binned datasets. Right: Long-term luminosity evolution of warm and cold dust components (Z22 and this work) compared to Hα line luminosities (circle: this work; triangles: adopted from Smith et al. 2017) produced dominantly by the part of the SN ejecta crossing and being excited by the reverse shock.
Current usage metrics show cumulative count of Article Views (full-text article views including HTML views, PDF and ePub downloads, according to the available data) and Abstracts Views on Vision4Press platform.
Data correspond to usage on the plateform after 2015. The current usage metrics is available 48-96 hours after online publication and is updated daily on week days.
Initial download of the metrics may take a while.