Fig. 3
Download original image
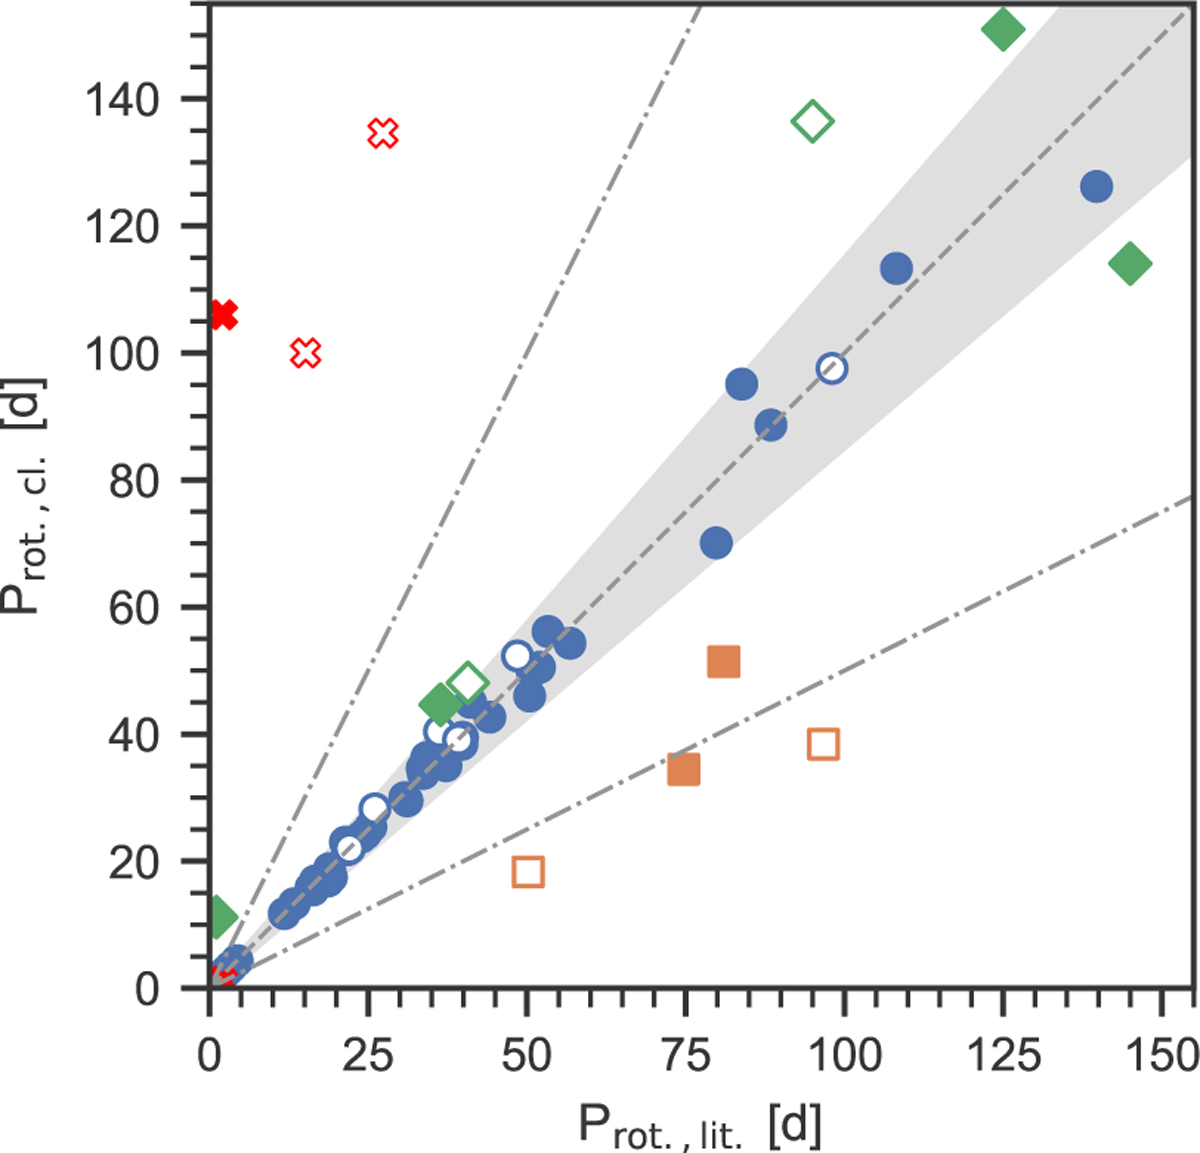
Comparison between rotation periods determined from the clustering algorithm and literature values. Depicted are the results for the signals found with the pre-whitening method in the periodogram analysis. Rotation periods where we found a direct match are depicted by blue circles. Cases where the period from the clustering algorithm is a harmonic or an alias of the literature period are marked by orange squares and green diamonds, respectively. Red crosses highlight stars where the period from the clustering algorithm has no apparent relation to the literature value. Filled symbols depict confirmed rotation periods, while open symbols depict tentative ones, following Shan et al. (2024). The grey shaded area and dashed line signal a 1-to-1 correlation with a margin of 15% of the value. A harmonic correlation (either double or half of the period) is indicated by the grey dashed-dotted lines.
Current usage metrics show cumulative count of Article Views (full-text article views including HTML views, PDF and ePub downloads, according to the available data) and Abstracts Views on Vision4Press platform.
Data correspond to usage on the plateform after 2015. The current usage metrics is available 48-96 hours after online publication and is updated daily on week days.
Initial download of the metrics may take a while.