Open Access
Fig. D.1
Download original image
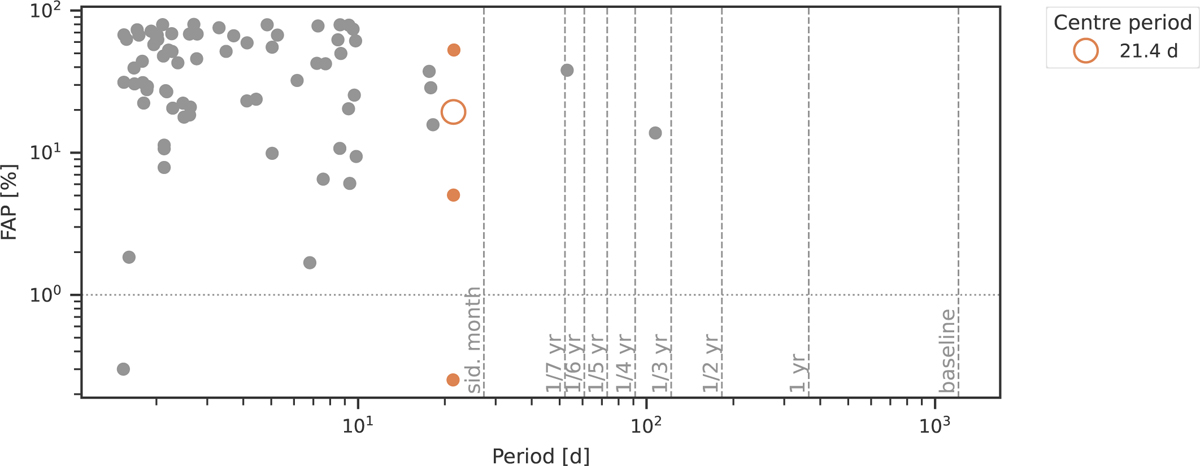
Results of the clustering algorithm for BD+09 2636 using the pre-whitening method with the yearly aliases removed. The FAP of 1% is marked by the grey horizontal dotted line and the grey vertical dashed lines show different periods of interest. The error bars of the data points correspond to the peak width in the GLS.
Current usage metrics show cumulative count of Article Views (full-text article views including HTML views, PDF and ePub downloads, according to the available data) and Abstracts Views on Vision4Press platform.
Data correspond to usage on the plateform after 2015. The current usage metrics is available 48-96 hours after online publication and is updated daily on week days.
Initial download of the metrics may take a while.