Fig. A.1.
Download original image
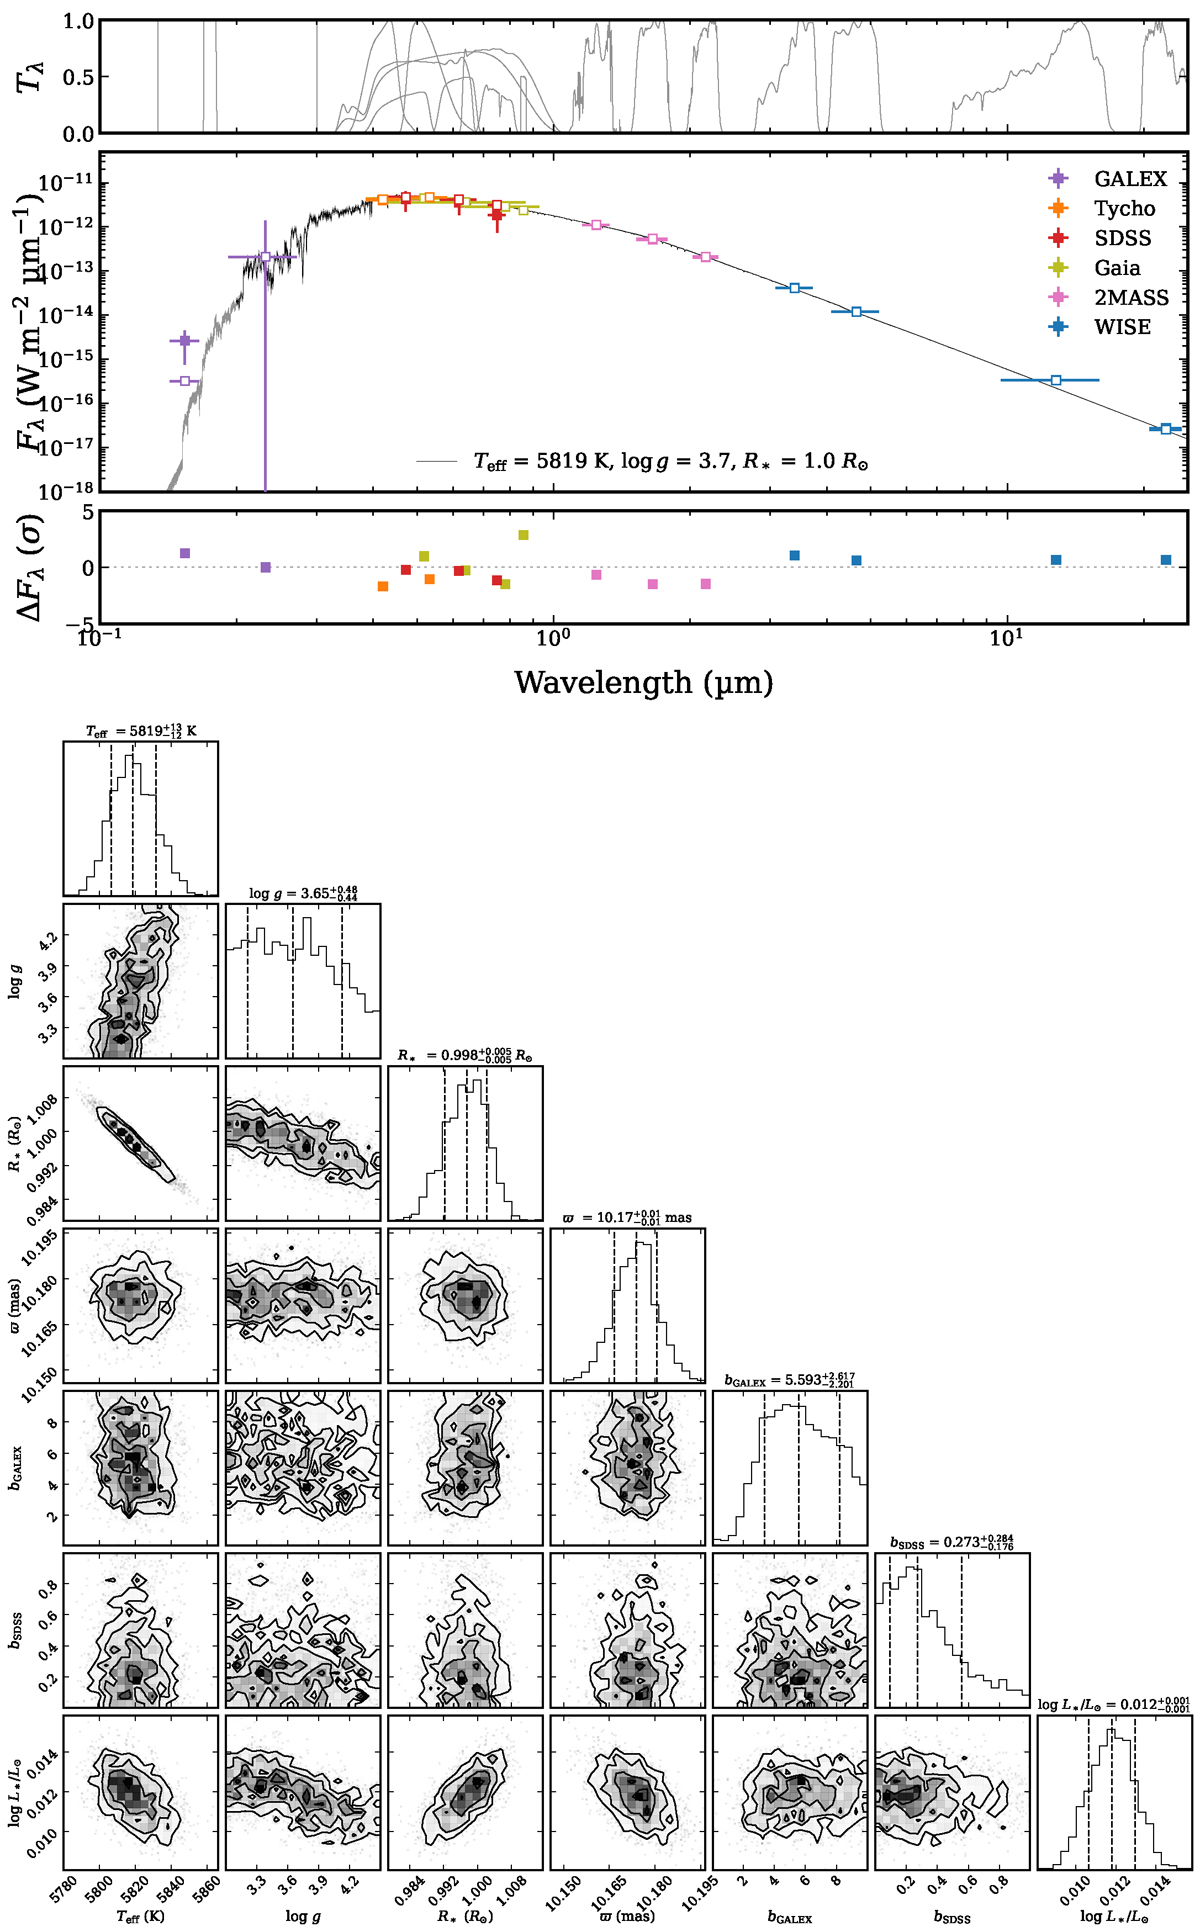
SED fitting of the central star using BT-Settl-CIFIST models. Upper panel: the filled squares with errorbar are the measured photometric data and the open squares are the modelled photometric data. The black line is the optimised model spectrum and the grey lines are 30 spectra randomly drawn from the posterior distributions. Lower panel: posteriors distributions of SED fitting. bGALEX and bSDSS are the inflation factors of the GALEX and SDSS photometric data.
Current usage metrics show cumulative count of Article Views (full-text article views including HTML views, PDF and ePub downloads, according to the available data) and Abstracts Views on Vision4Press platform.
Data correspond to usage on the plateform after 2015. The current usage metrics is available 48-96 hours after online publication and is updated daily on week days.
Initial download of the metrics may take a while.