Fig. 3.
Download original image
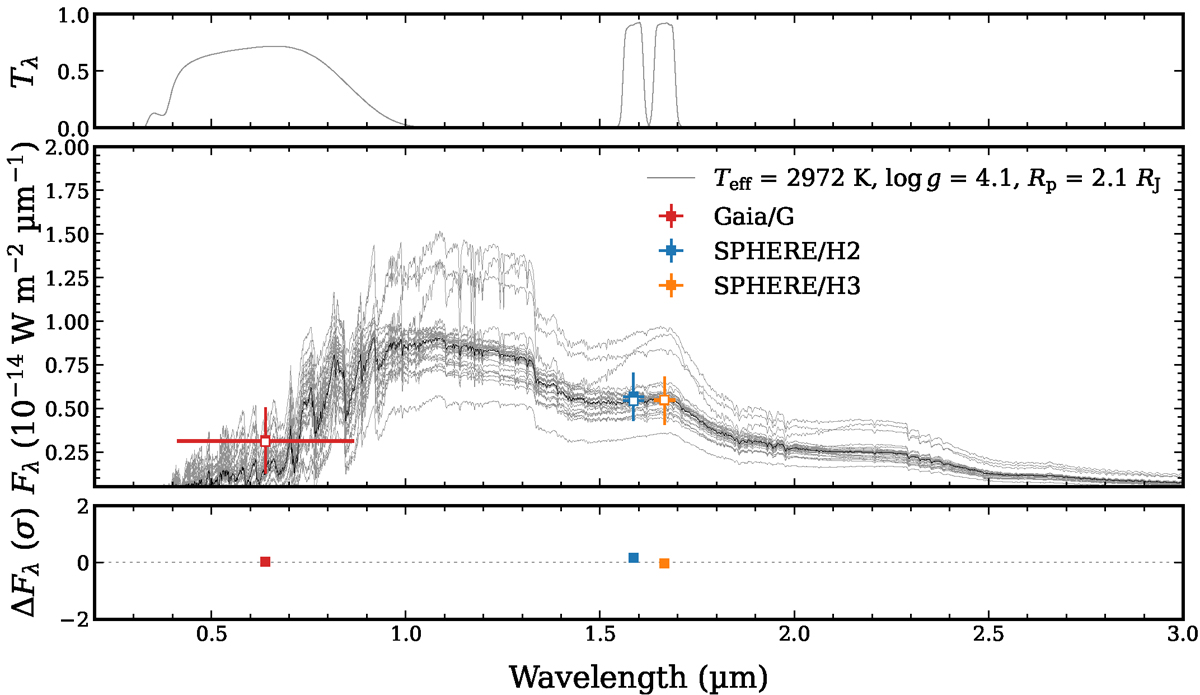
SED fitting of the companion, combining the Gaia G, and SPHERE H2 and H3 photometric bands using BT-Settl atmospheric models. The filled squares are the measured photometric data with error bars, and the open squares are the modelled photometric data. The grey lines are 30 spectra randomly drawn from the posterior distributions. The upper panel shows the transmission of photometric bands, and the lower panel shows the residuals in σ.
Current usage metrics show cumulative count of Article Views (full-text article views including HTML views, PDF and ePub downloads, according to the available data) and Abstracts Views on Vision4Press platform.
Data correspond to usage on the plateform after 2015. The current usage metrics is available 48-96 hours after online publication and is updated daily on week days.
Initial download of the metrics may take a while.