Open Access
Fig. 2.
Download original image
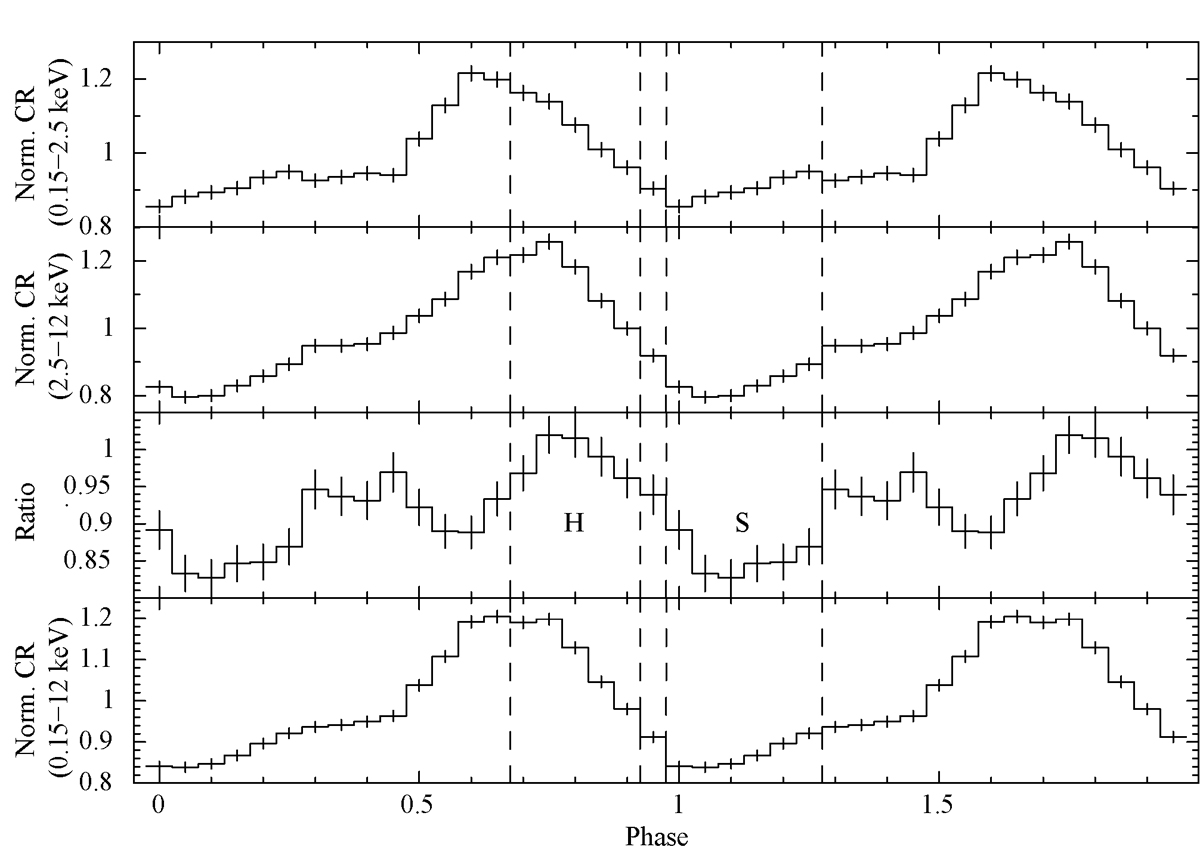
Light curves of 4U 0728-25 in the full (bottom panel), S (top panel) and H (second panel) energy ranges, together with the HR (third panel), folded at the pulse period P = 103.301 s. The phase ranges selected for the phase-resolved spectral analysis are delimited with vertical dashed lines.
Current usage metrics show cumulative count of Article Views (full-text article views including HTML views, PDF and ePub downloads, according to the available data) and Abstracts Views on Vision4Press platform.
Data correspond to usage on the plateform after 2015. The current usage metrics is available 48-96 hours after online publication and is updated daily on week days.
Initial download of the metrics may take a while.