Fig. 4
Download original image
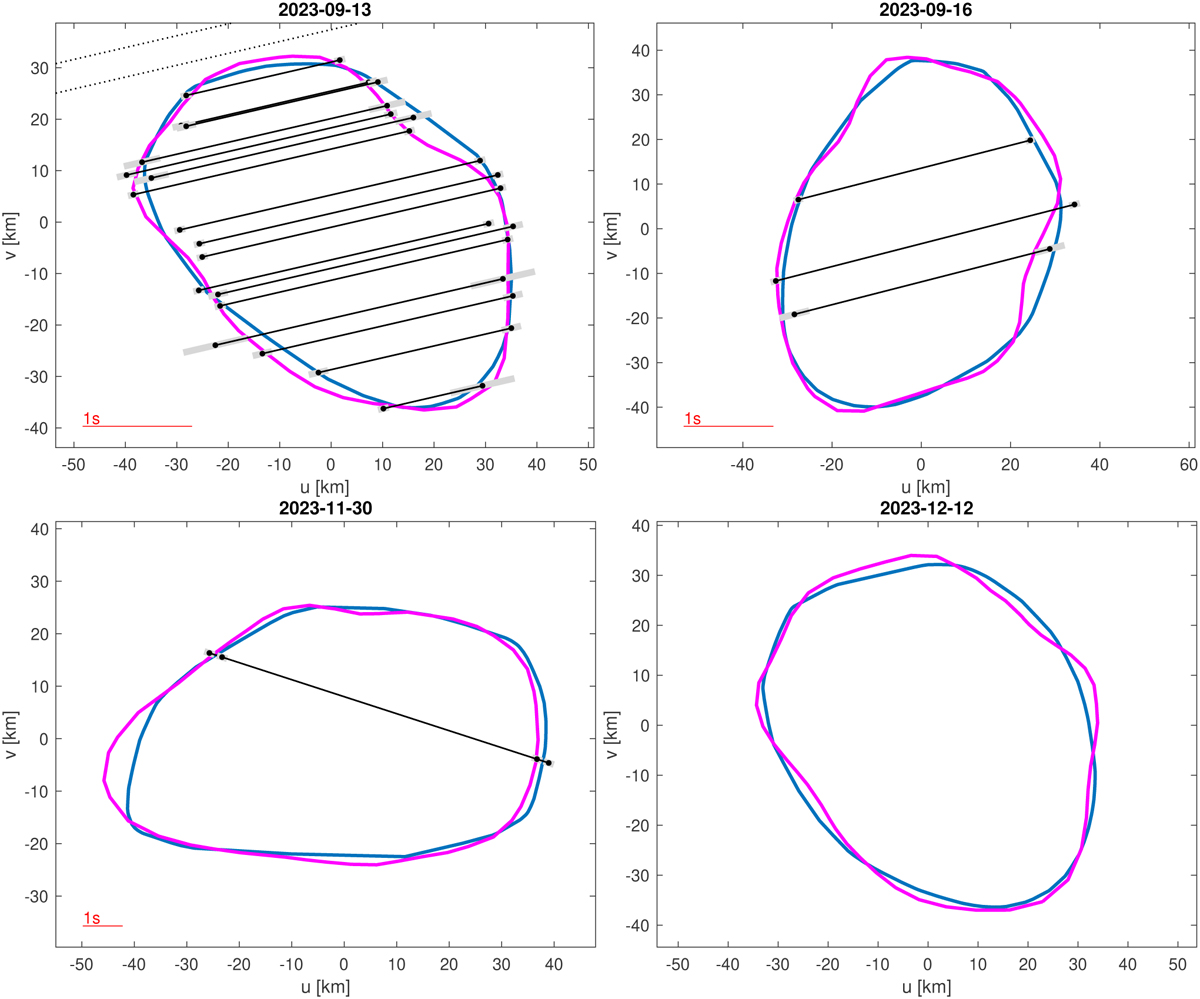
Projections of the models. Silhouettes of the best-fit convex (blue) and nonconvex (magenta) shape models are shown for four occultations. The chords are shown as solid lines with gray timing error bars at their ends. The dotted straight lines in the first panel are negative observations. The red line gives the time scale, which is one second long. The last panel shows the prediction of the silhouette for the Betelgeuse occultation.
Current usage metrics show cumulative count of Article Views (full-text article views including HTML views, PDF and ePub downloads, according to the available data) and Abstracts Views on Vision4Press platform.
Data correspond to usage on the plateform after 2015. The current usage metrics is available 48-96 hours after online publication and is updated daily on week days.
Initial download of the metrics may take a while.