Open Access
Fig. 8
Download original image
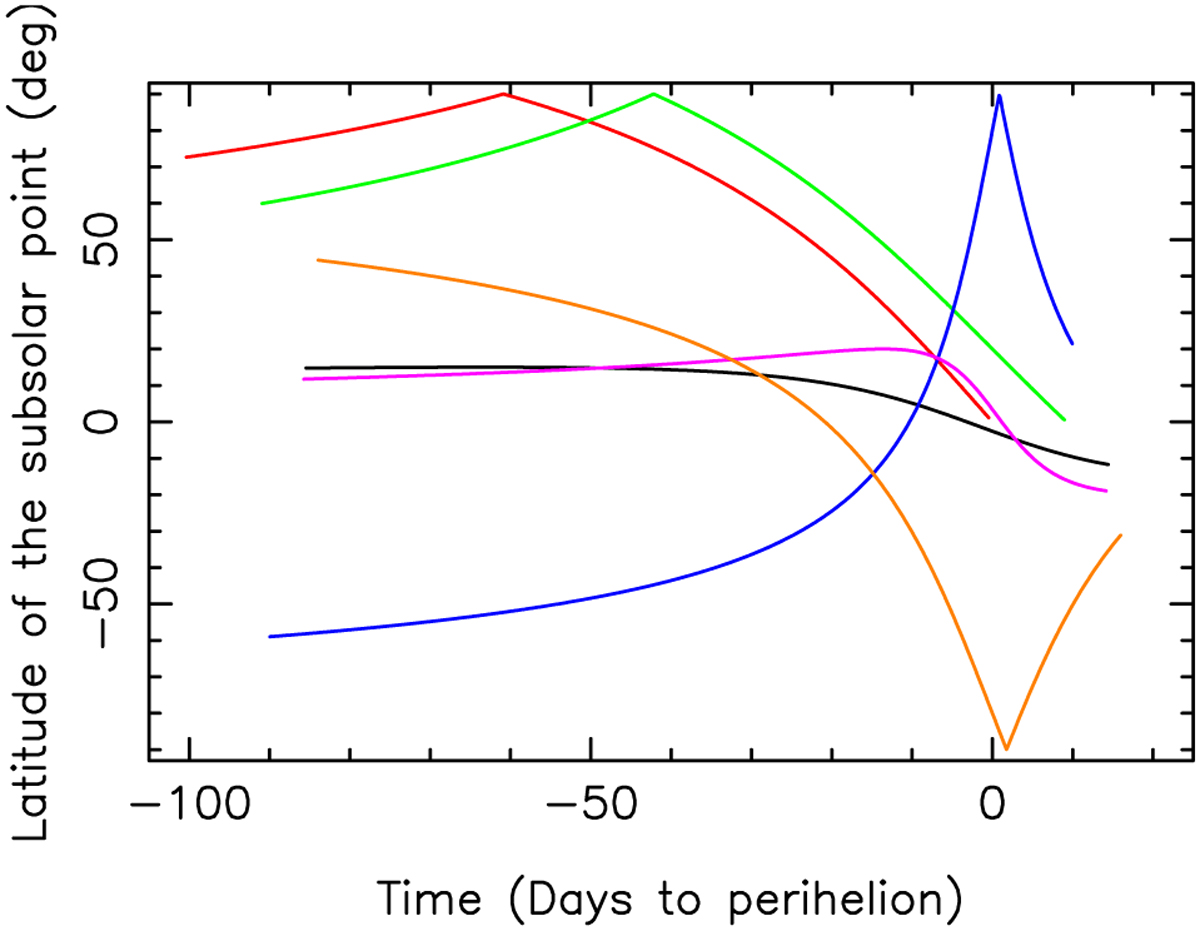
Latitude of the subsolar point as a function of time for the objects listed in Table 1 with the rotational parameters displayed in Table 2. The different colors correspond to the distinct objects as follows: black, C/1858 L1; red, C/1874 H1; green, C/1881 K1; blue, C/1901 G1; purple, C/2020 F3; and brown, C/2023 A3.
Current usage metrics show cumulative count of Article Views (full-text article views including HTML views, PDF and ePub downloads, according to the available data) and Abstracts Views on Vision4Press platform.
Data correspond to usage on the plateform after 2015. The current usage metrics is available 48-96 hours after online publication and is updated daily on week days.
Initial download of the metrics may take a while.