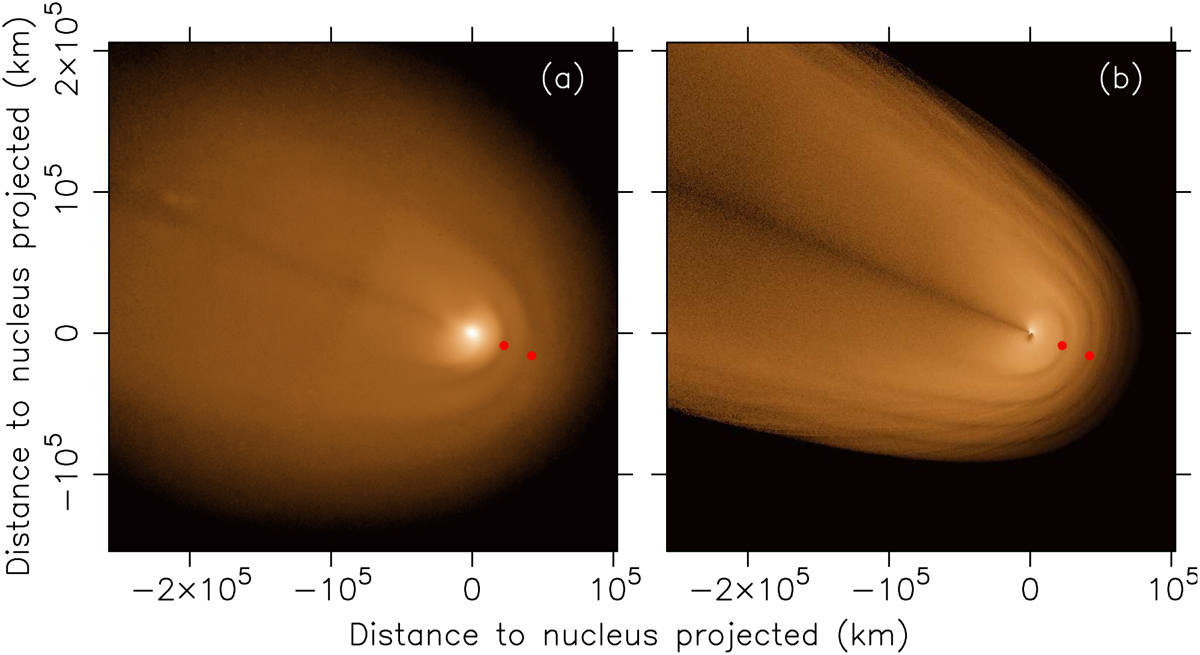
Fig. 7
Download original image
Comet C/2023 A3 (Tsuchinshan-ATLAS). Panel a is an image obtained by José Carrillo7, reprinted with the author’s written permission. Panel b is the simulated image. Red dots indicate the position of the first and second dark intervals between shells along the tail axis in both the observation and the simulation. North is up; east is to the left.
Current usage metrics show cumulative count of Article Views (full-text article views including HTML views, PDF and ePub downloads, according to the available data) and Abstracts Views on Vision4Press platform.
Data correspond to usage on the plateform after 2015. The current usage metrics is available 48-96 hours after online publication and is updated daily on week days.
Initial download of the metrics may take a while.