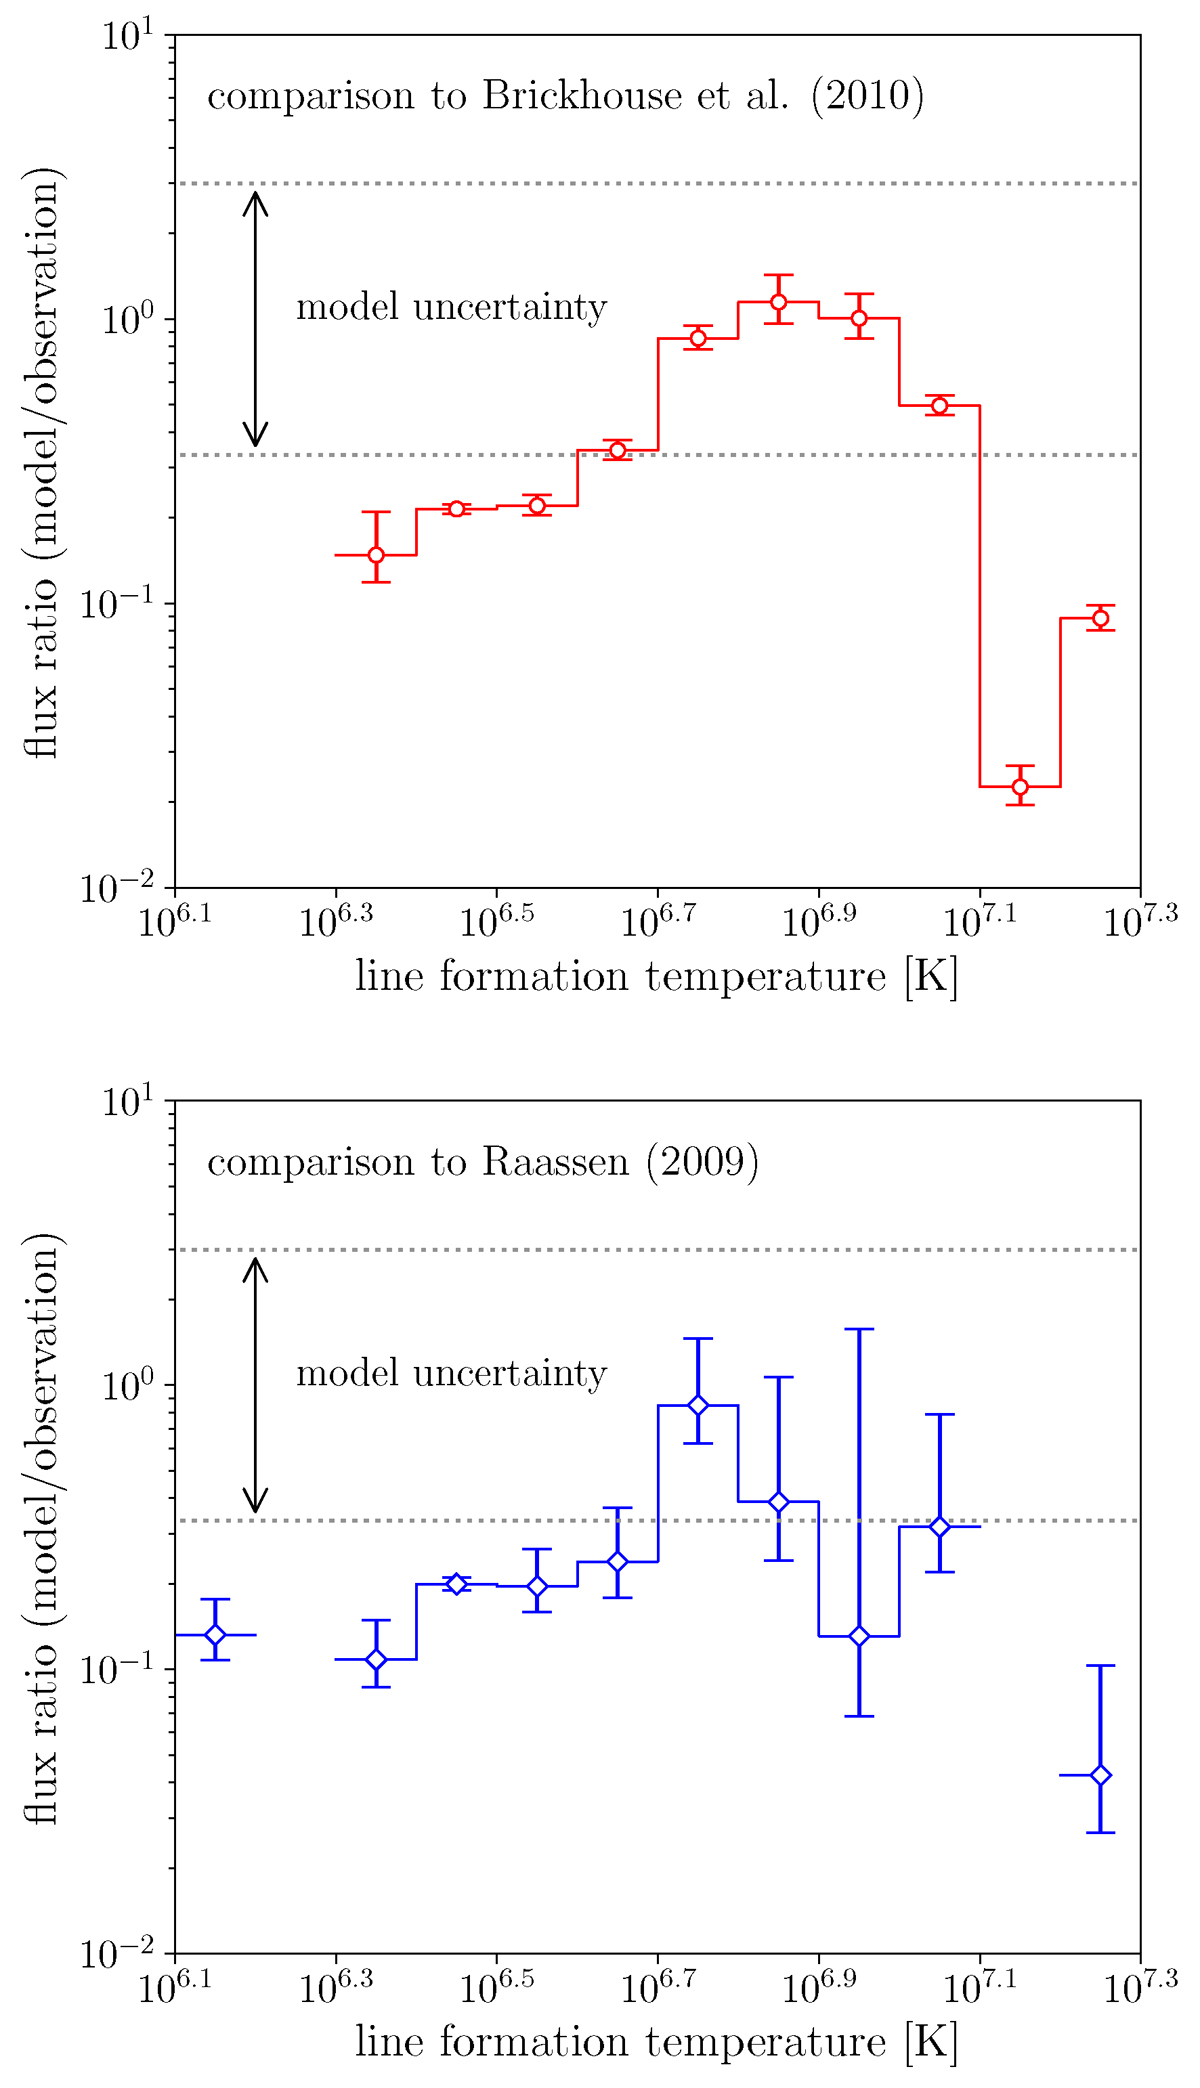
Fig. C.1.
Download original image
Ratio of modelled photon flux to observed photon flux across various line formation temperatures (Tmax). The top panel compares results with Brickhouse et al. (2010) and the bottom panel with Raassen (2009). Ratios are computed for individual emission lines and averaged in temperature bins of 0.1 dex. Error bars indicate 1-sigma observational uncertainties, and dotted lines represent the estimated range of the model uncertainty.
Current usage metrics show cumulative count of Article Views (full-text article views including HTML views, PDF and ePub downloads, according to the available data) and Abstracts Views on Vision4Press platform.
Data correspond to usage on the plateform after 2015. The current usage metrics is available 48-96 hours after online publication and is updated daily on week days.
Initial download of the metrics may take a while.