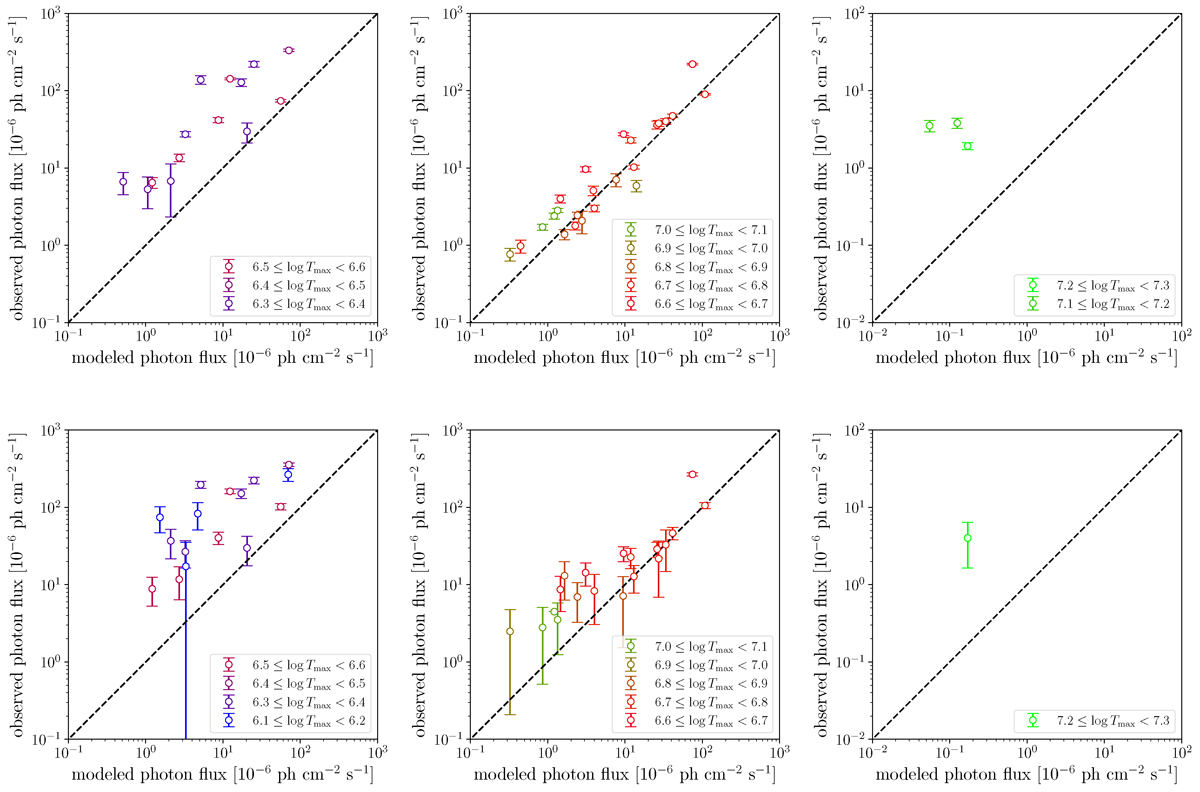
Fig. 4.
Download original image
Comparison of the modelled emission-line intensities with the absorption-corrected observed values. The top panels compare the model results with those from Brickhouse et al. (2010), and the bottom panels compare them with Raassen (2009). The panels from left to right correspond to emission lines formed at low (log Tmax < 6.6), medium (6.6 < log Tmax < 7.1), and high temperatures (log Tmax > 7.1), respectively. The error bars represent the 1σ statistical errors listed in Table D.1.
Current usage metrics show cumulative count of Article Views (full-text article views including HTML views, PDF and ePub downloads, according to the available data) and Abstracts Views on Vision4Press platform.
Data correspond to usage on the plateform after 2015. The current usage metrics is available 48-96 hours after online publication and is updated daily on week days.
Initial download of the metrics may take a while.