Fig. 9
Download original image
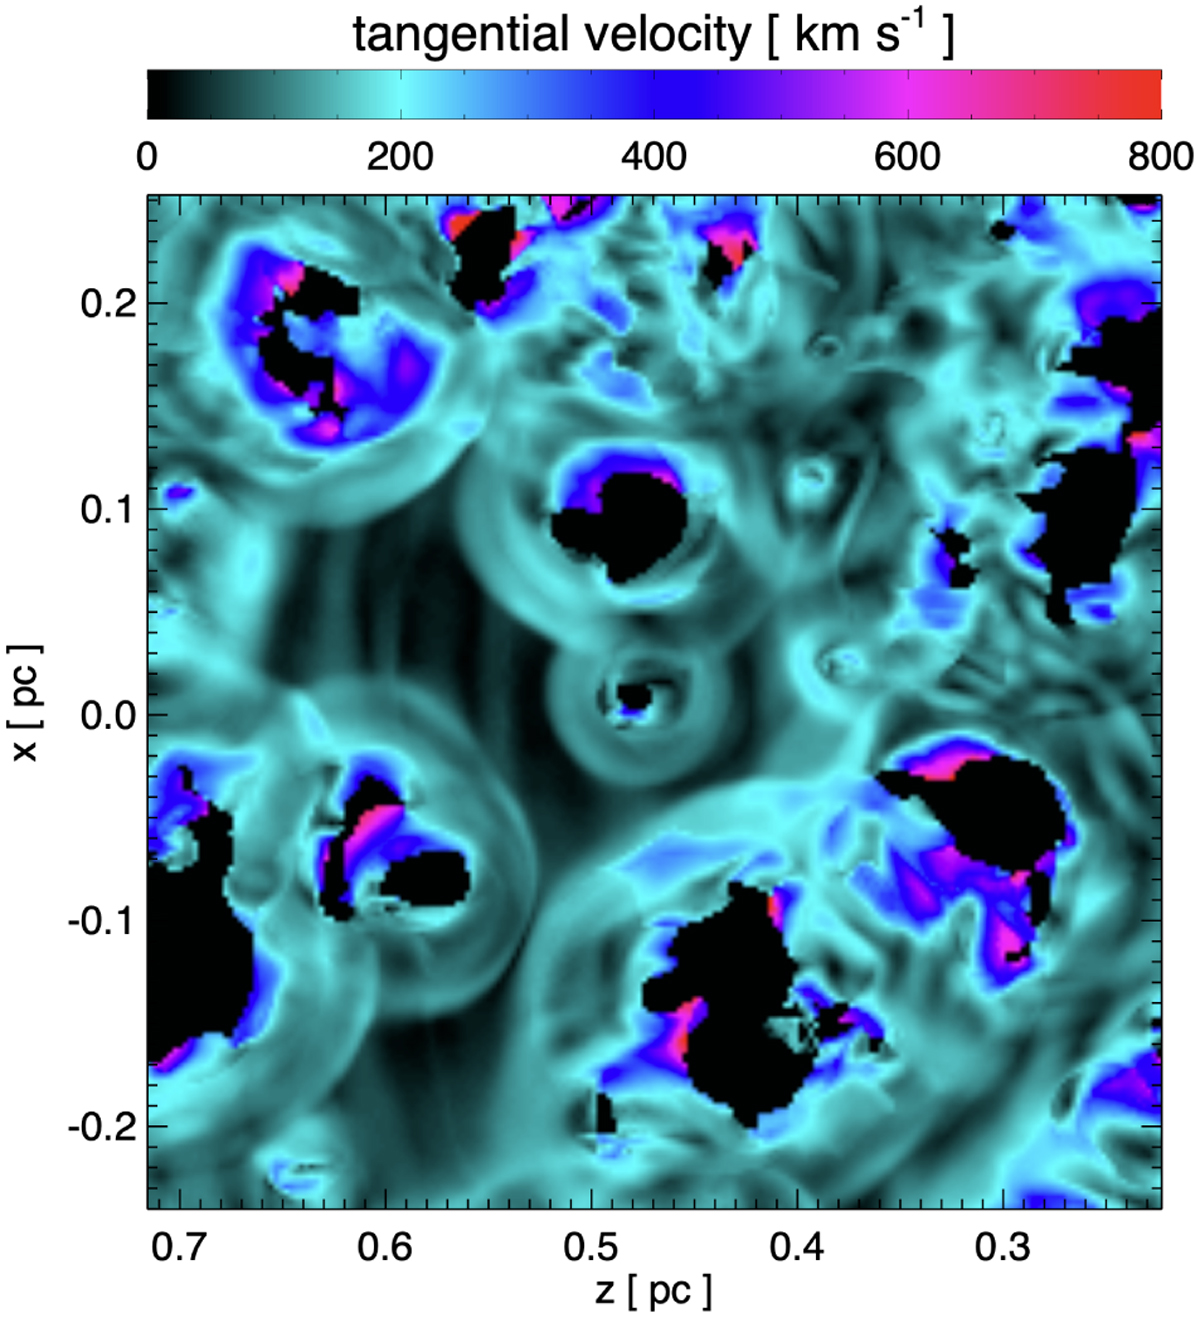
Tangential velocities of the shell material relative to the LoS for the region analyzed in Fig. 6. The velocities are averaged along the LoS and weighted by the shell’s density, including only cells where the density exceeds 5% of the maximum value of the shell density in the volume analyzed. The results are derived from the W15-IIb-sh-MHD+dec-rl-hr model at the evolutionary stage corresponding to Cas A. The irregular shapes of many holes are partly due to difficulty in identifying shell material and distinguishing it from ejecta within the holes (see text) and partly due to the superposition of multiple holes.
Current usage metrics show cumulative count of Article Views (full-text article views including HTML views, PDF and ePub downloads, according to the available data) and Abstracts Views on Vision4Press platform.
Data correspond to usage on the plateform after 2015. The current usage metrics is available 48-96 hours after online publication and is updated daily on week days.
Initial download of the metrics may take a while.