Fig. 8
Download original image
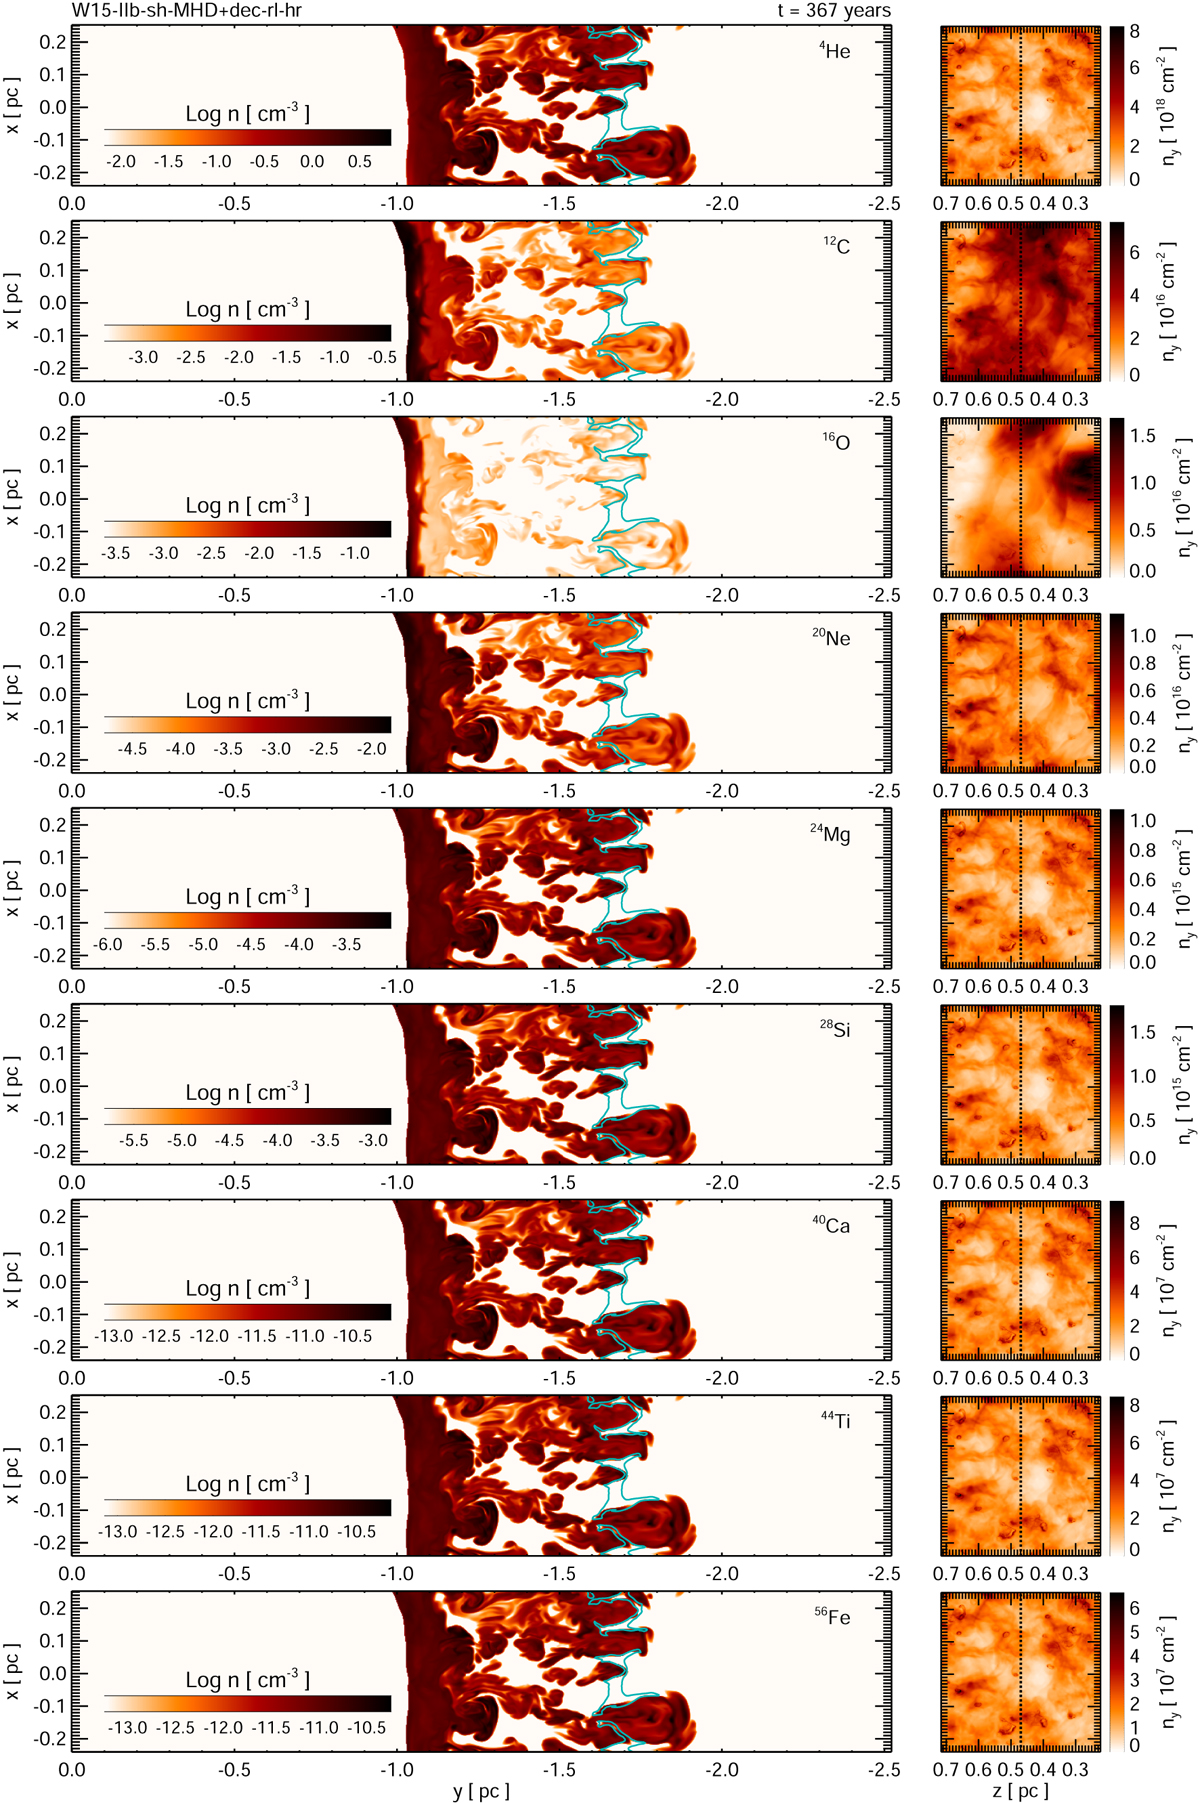
Left panels: cross-sections of the density distribution for selected ejecta species in a plane aligned with the LoS, corresponding to the region shown in Fig. 6. The color bar in each panel represents the density in log scale. The light blue contour outlines the material of the shocked shell. Right panels: corresponding 3D volumetric renderings of the same quantities as seen from Earth’s vantage point. The color bar on the right of each panel shows the column density in linear scale. The vertical dashed line marks the location of the cross-sections shown in the left panels. The results are derived from the W15-IIb-sh-MHD+dec-rl-hr model at the evolutionary stage corresponding to Cas A.
Current usage metrics show cumulative count of Article Views (full-text article views including HTML views, PDF and ePub downloads, according to the available data) and Abstracts Views on Vision4Press platform.
Data correspond to usage on the plateform after 2015. The current usage metrics is available 48-96 hours after online publication and is updated daily on week days.
Initial download of the metrics may take a while.