Fig. 7
Download original image
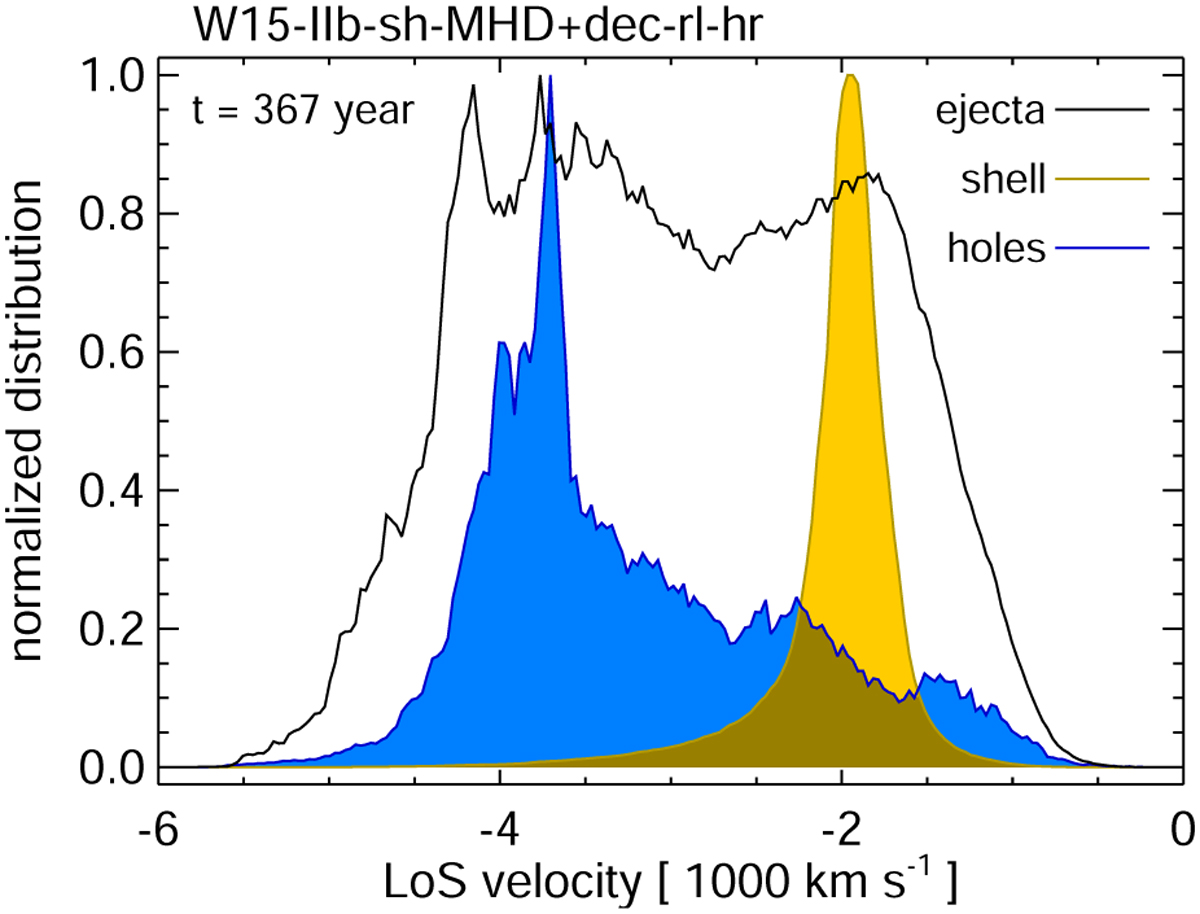
Normalized LoS velocity distribution of the shocked ejecta (black curve), shocked shell (orange curve), and the shocked ejecta filling the holes (blue curve) in the region shown in Fig. 6. The analysis is restricted to plasma with coordinates y < –1.5 pc, corresponding to the domain where the shocked shell interacts with the ejecta. The results are derived from the W15-IIb-sh-MHD+dec-rl-hr model at the evolutionary stage corresponding to Cas A.
Current usage metrics show cumulative count of Article Views (full-text article views including HTML views, PDF and ePub downloads, according to the available data) and Abstracts Views on Vision4Press platform.
Data correspond to usage on the plateform after 2015. The current usage metrics is available 48-96 hours after online publication and is updated daily on week days.
Initial download of the metrics may take a while.