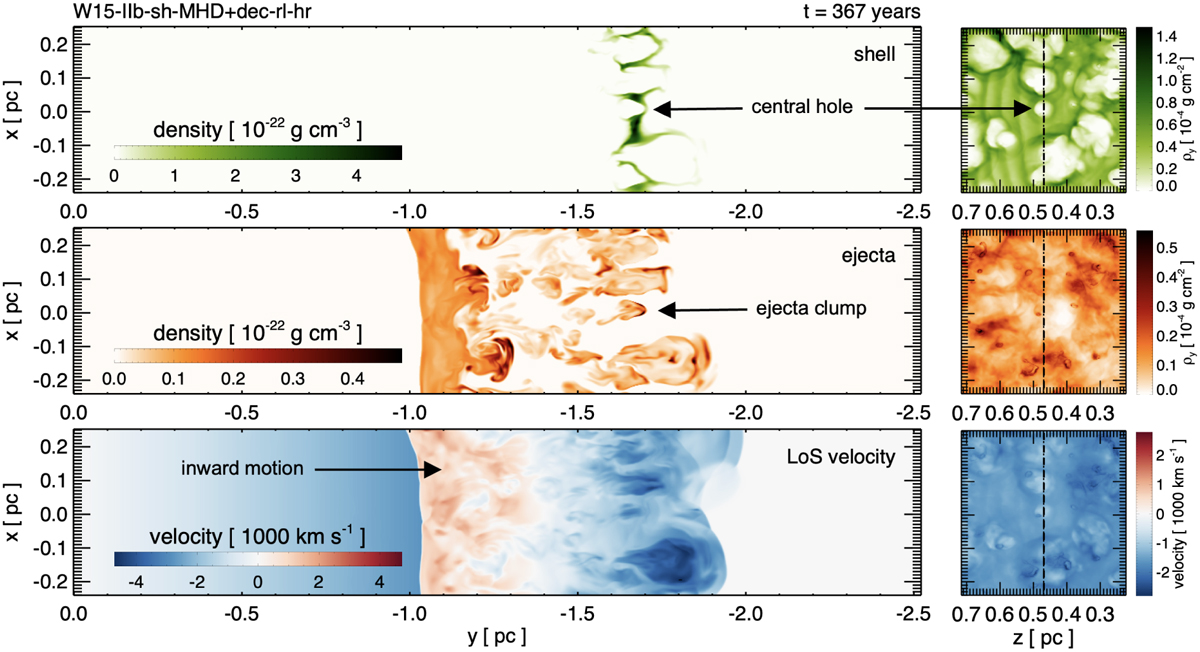
Fig. 6
Download original image
Visualization of the plasma structure in a region where the SN ejecta interact with the circumstellar shell in model W15-IIb-sh-MHD+dec- rl-hr at the age of Cas A. This region corresponds to an enlarged view of region 6 in Fig. 10, highlighted by the dashed box. The left panels display cross-sections of the shell density (top), shocked ejecta density (middle), and LoS velocity (bottom) in a plane oriented along the LoS. The density distribution of the unshocked ejecta in the interior is not shown. The right panels provide 3D volumetric renderings of the same quantities within the selected region, as seen from Earth’s vantage point: surface density of the shell (top) and of the shocked ejecta (middle), and the density weighted LoS velocity average (bottom). The vertical dashed line in the 3D renderings marks the location of the cross-sections shown in the left panels, facilitating direct comparison between the two perspectives. See Movie 2 available online for an animation of these data. A navigable 3D graphic of the evolution of this region is available at https://skfb.ly/ptFHY.
Current usage metrics show cumulative count of Article Views (full-text article views including HTML views, PDF and ePub downloads, according to the available data) and Abstracts Views on Vision4Press platform.
Data correspond to usage on the plateform after 2015. The current usage metrics is available 48-96 hours after online publication and is updated daily on week days.
Initial download of the metrics may take a while.