Fig. A.2
Download original image
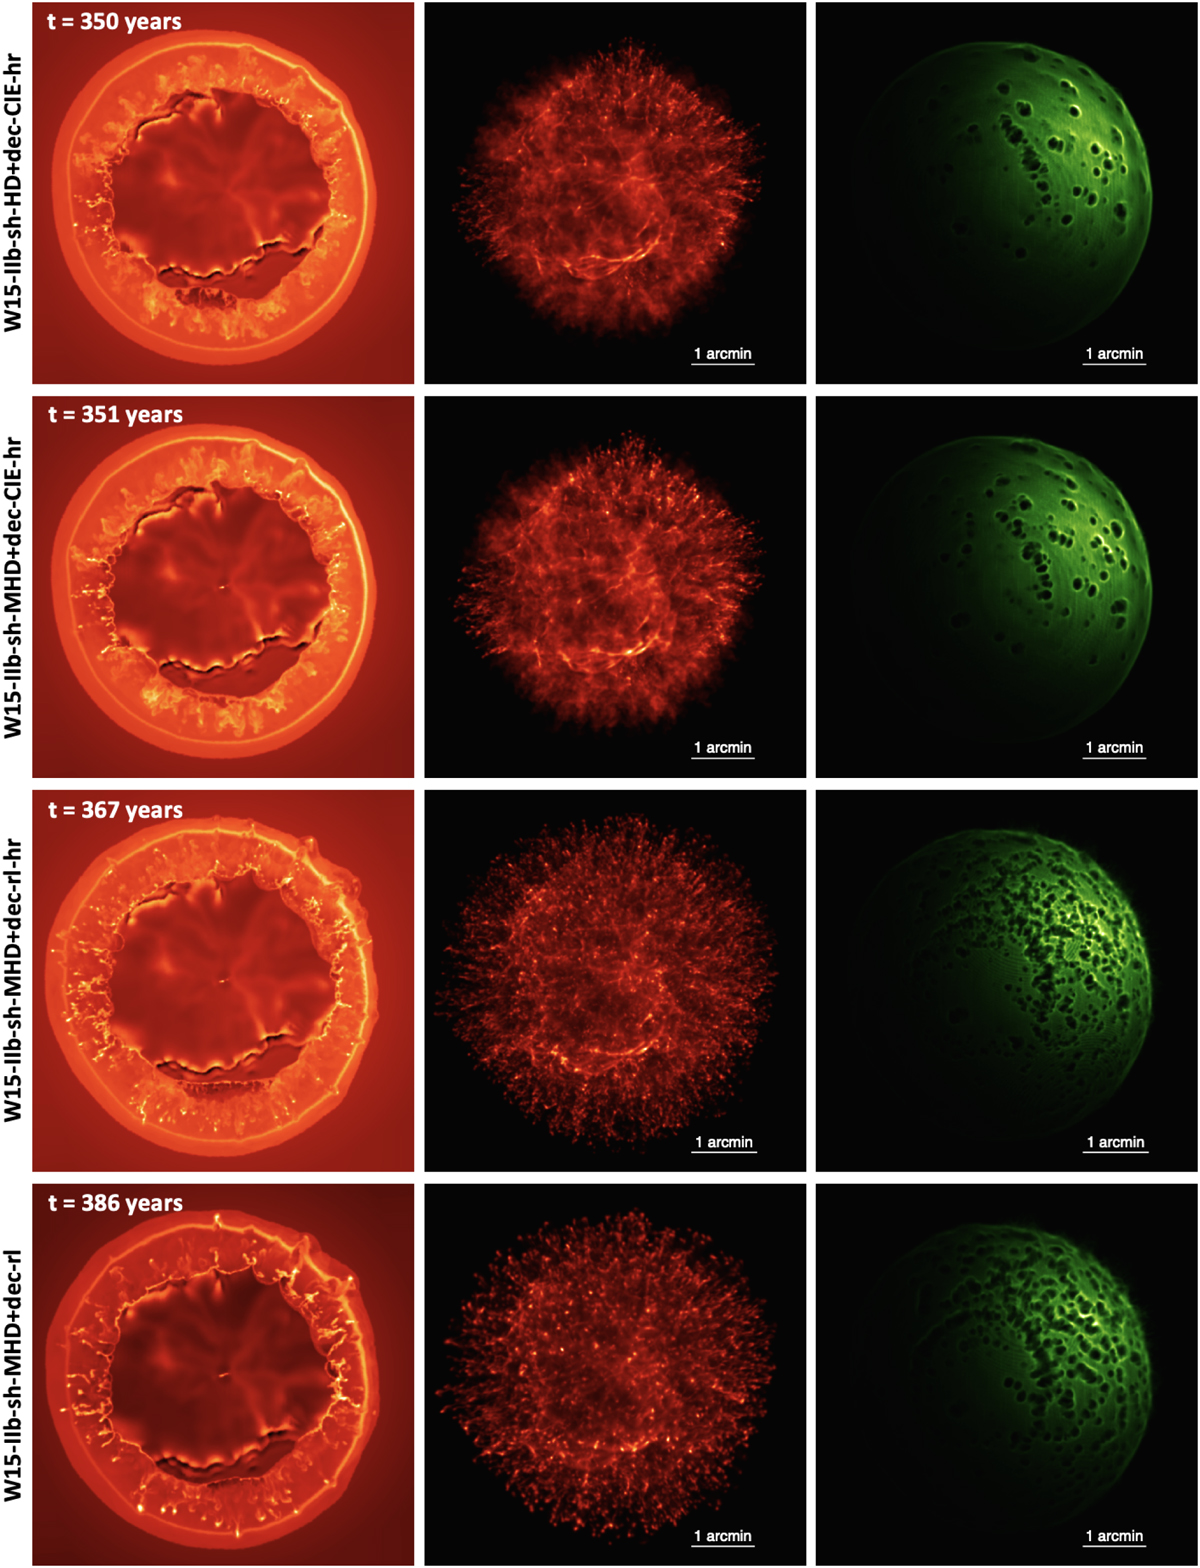
Comparison of density distributions from the test simulations reported in Table A.1 and model W15-IIb-sh-MHD+dec-rl-hr (Table 1). The figure presents 2D slices in the (x, z) plane showing the plasma density distribution in logarithmic scale (left panels), along with 3D volumetric renderings of the ejecta (center panels) and shell (right panels) at the labeled times (see upper left corner in the left panels).
Current usage metrics show cumulative count of Article Views (full-text article views including HTML views, PDF and ePub downloads, according to the available data) and Abstracts Views on Vision4Press platform.
Data correspond to usage on the plateform after 2015. The current usage metrics is available 48-96 hours after online publication and is updated daily on week days.
Initial download of the metrics may take a while.