Fig. 1
Download original image
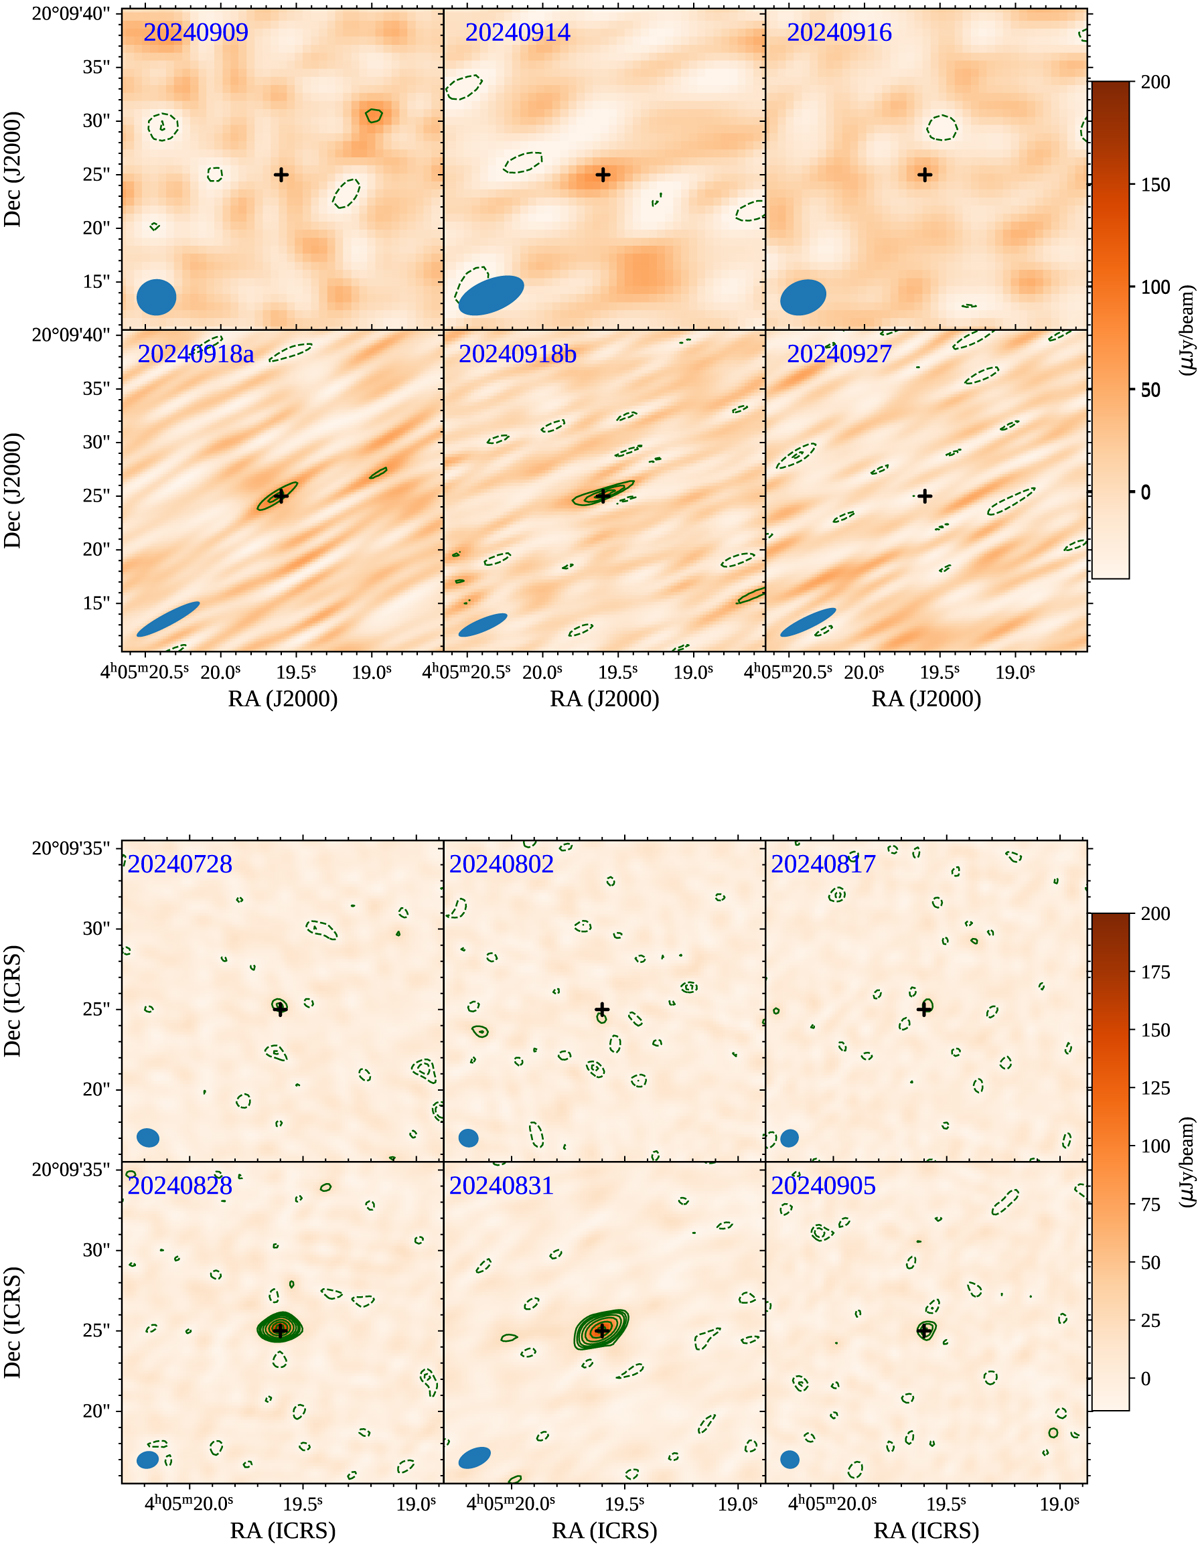
Stokes I radio maps centred on V1298 Tau (the location of the target is indicated by a cross) that we obtained with JVLA at each epoch of observation (upper image: L-band; lower image: C-band). The observing date is indicated in the upper left corner of each panel. The beam sizes are sketched in the bottom left corner. Contours are −3, −2, 3, 4 5, 7, 10, 15, 20, 25, 40 times the RMS of each map. The background colour scale ranges from −43 to 200 µJy/beam for L-band and from −14 to 200 µJy/beam for C-band.
Current usage metrics show cumulative count of Article Views (full-text article views including HTML views, PDF and ePub downloads, according to the available data) and Abstracts Views on Vision4Press platform.
Data correspond to usage on the plateform after 2015. The current usage metrics is available 48-96 hours after online publication and is updated daily on week days.
Initial download of the metrics may take a while.