Open Access
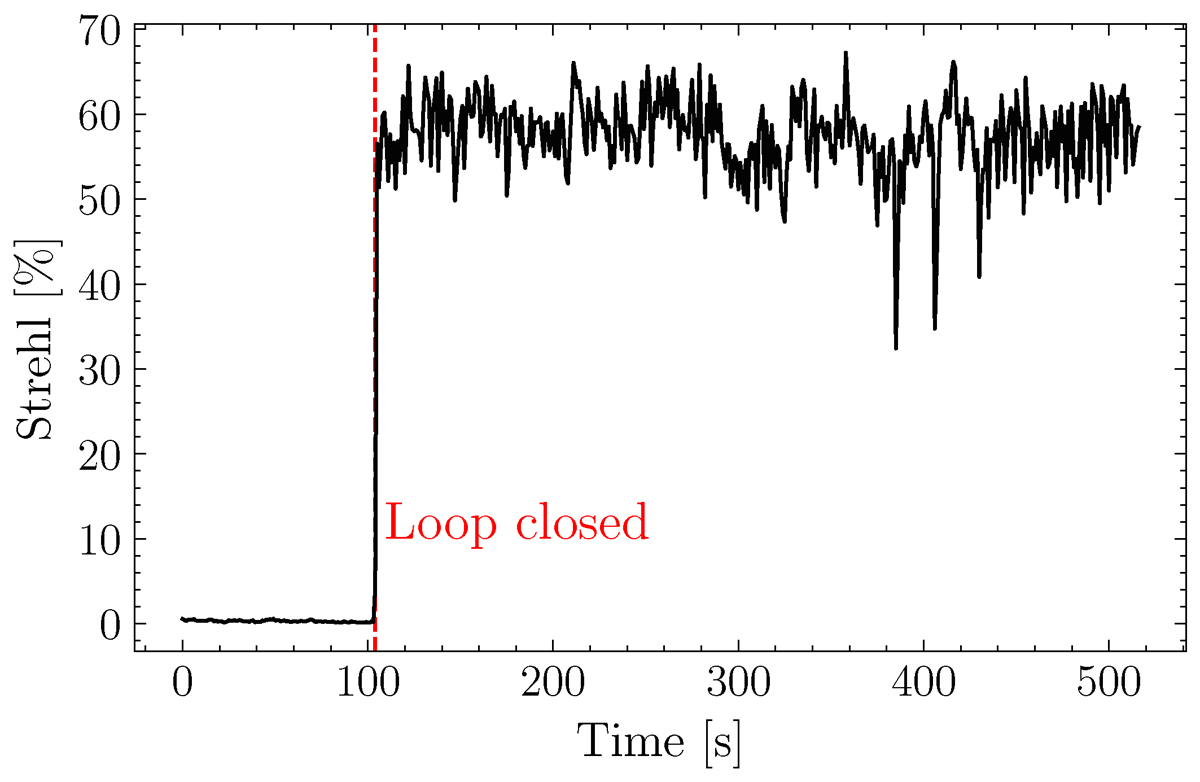
Fig. 3.
Download original image
Measured Strehl ratio as a function of time for the test on α Eri on November 16, 2024, showing a generally stable performance over time. The vertical dashed red line indicates the time at which the control loop was closed. There are three frames in which the Strehl ratio drops significantly due to latency on the GPU.
Current usage metrics show cumulative count of Article Views (full-text article views including HTML views, PDF and ePub downloads, according to the available data) and Abstracts Views on Vision4Press platform.
Data correspond to usage on the plateform after 2015. The current usage metrics is available 48-96 hours after online publication and is updated daily on week days.
Initial download of the metrics may take a while.