Fig. 9
Download original image
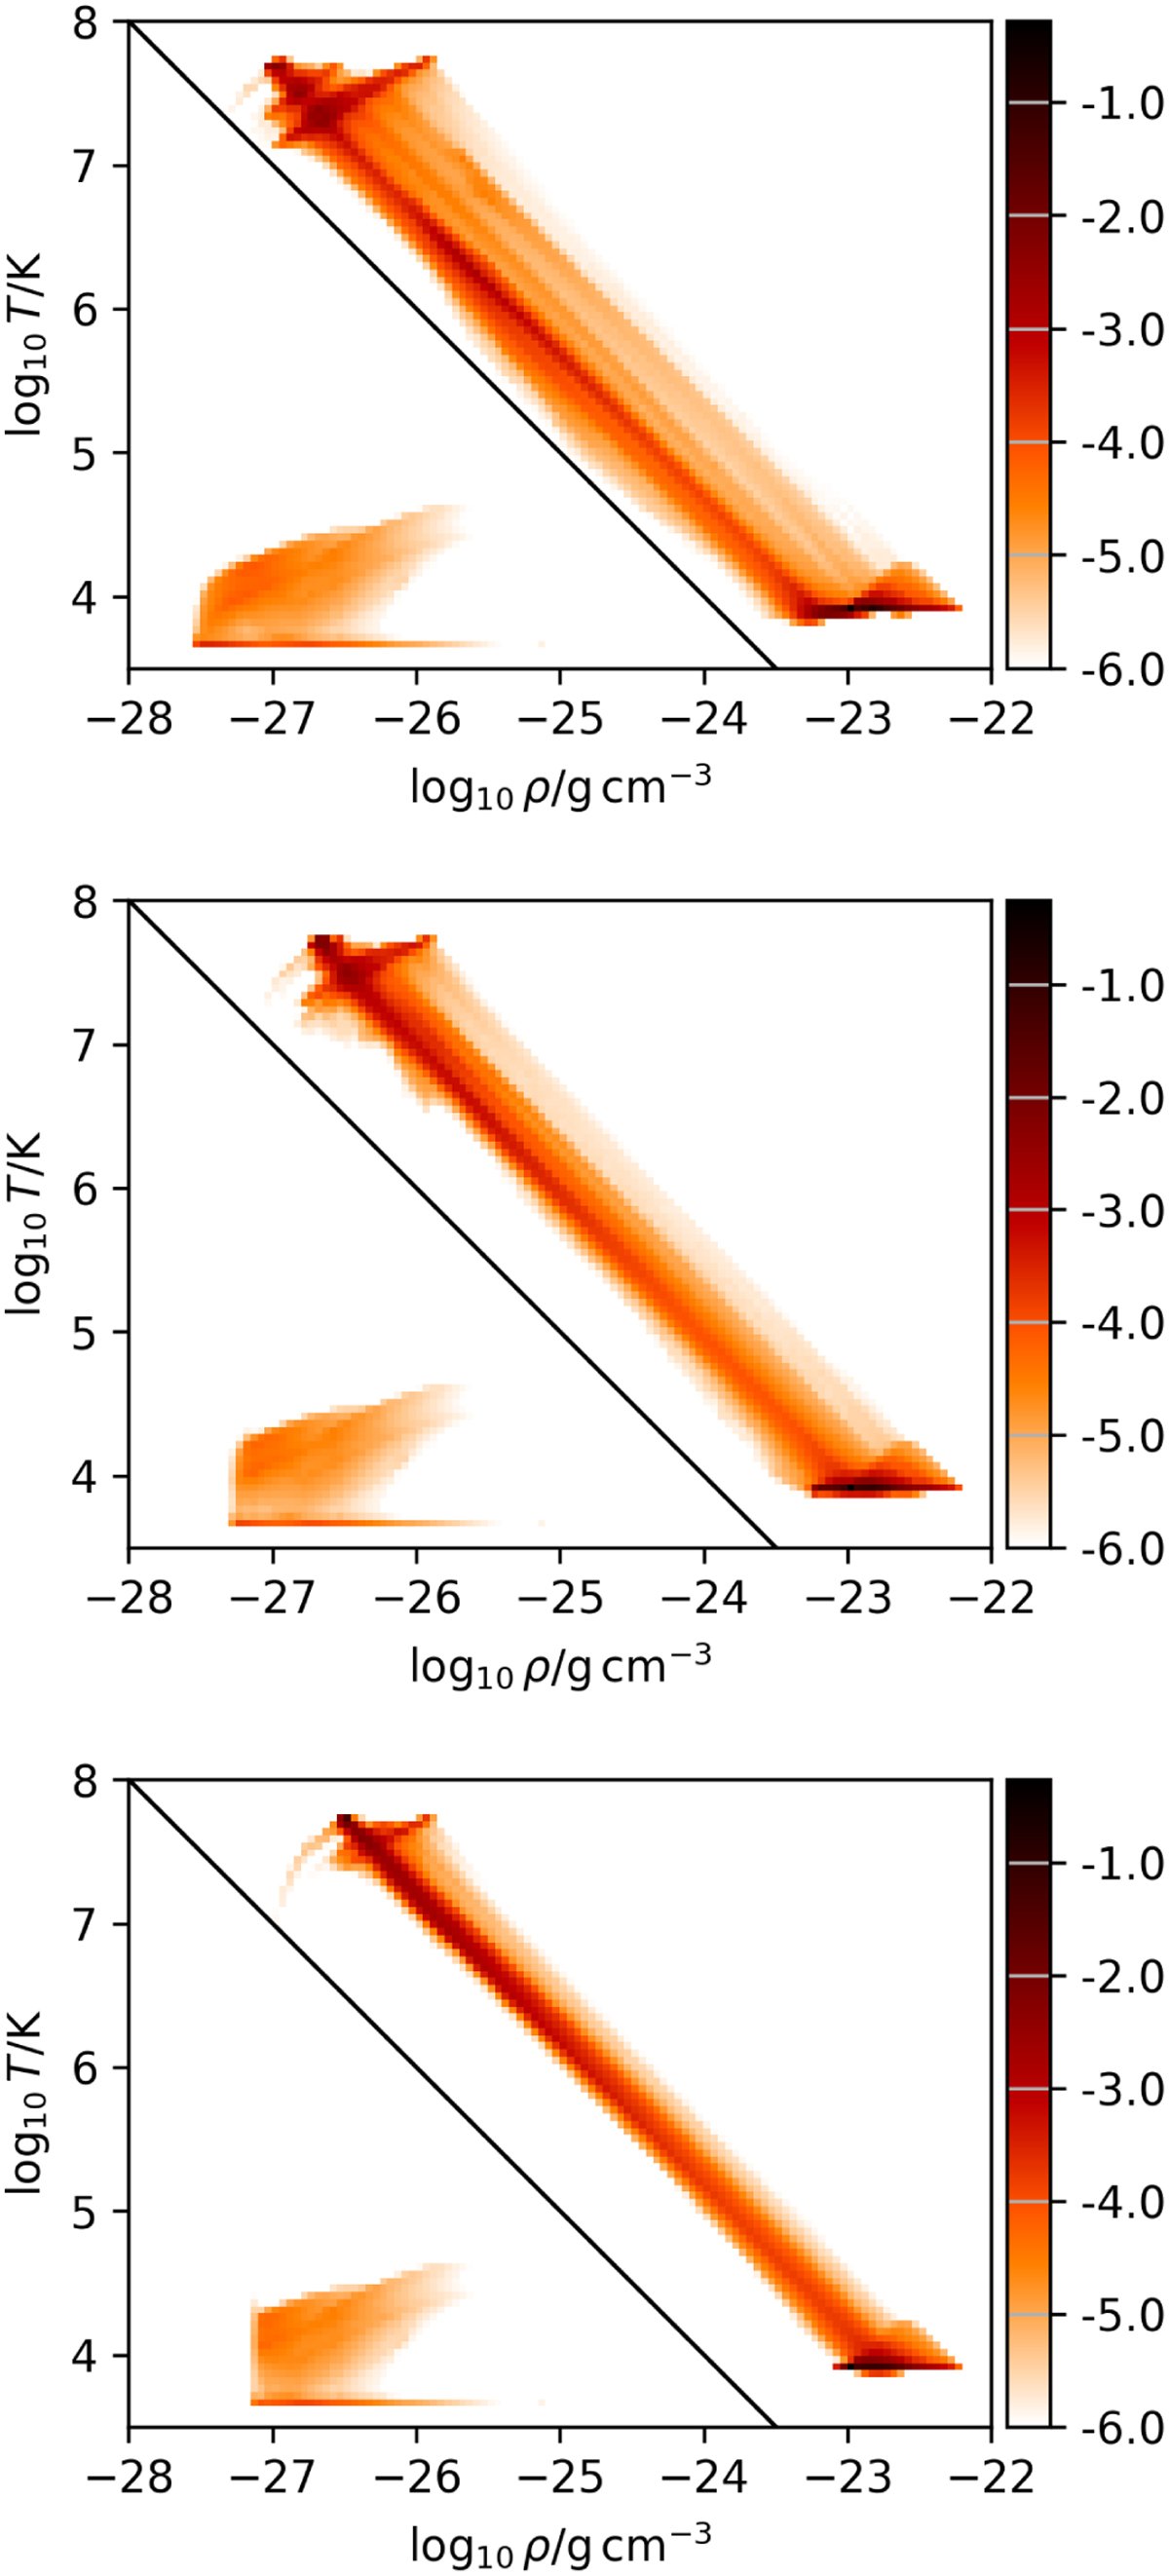
Volume fraction of gas in the ρ − T plane for simulation 3D-3-by7 at times t = 0.35 Myr (top), 0.39 Myr (middle) and 0.43 Myr (bottom). The colour scale shows log10 of the fraction of the simulation volume within the density and temperature range enclosed by each pixel. These simulations have the ISM magnetic field in configuration 2, almost perpendicular to the space velocity of the star through the ISM. The black line shows a line of constant pressure, p/kB ≈ 104 cm−3 K.
Current usage metrics show cumulative count of Article Views (full-text article views including HTML views, PDF and ePub downloads, according to the available data) and Abstracts Views on Vision4Press platform.
Data correspond to usage on the plateform after 2015. The current usage metrics is available 48-96 hours after online publication and is updated daily on week days.
Initial download of the metrics may take a while.