Fig. 7
Download original image
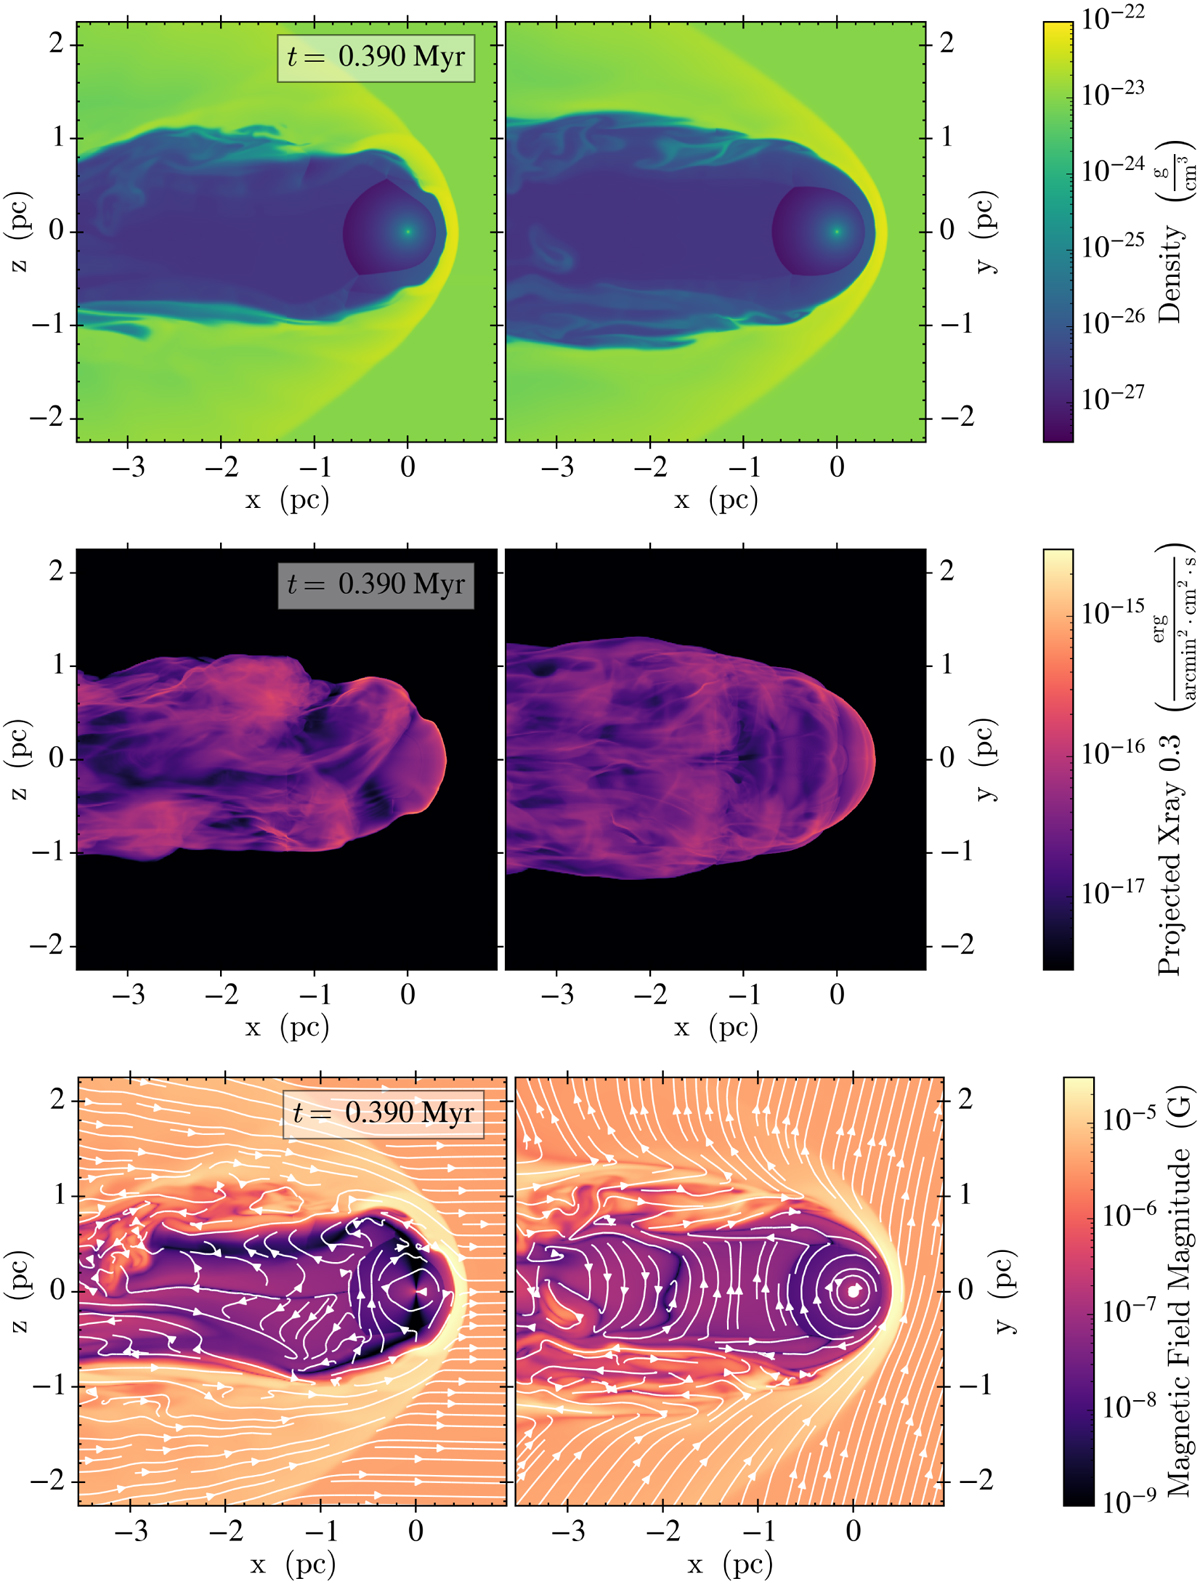
For simulation 3D-3-by7 at simulation time 0.39 Myr, from top to bottom: slices showing gas density in the planes y = 0 (left) and ɀ = 0 (right); projected thermal X-ray intensity in the 0.3–2 keV band along the ŷ (left) and ẑ axes (right); and slices of magnetic field strength on a logarithmic colour scale with field orientation shown as streamlines in the planes y = 0 (left) and ɀ = 0 (right). This simulation has the ISM magnetic field in configuration 2, almost perpendicular to the space velocity of the star through the ISM and with no ẑ component.
Current usage metrics show cumulative count of Article Views (full-text article views including HTML views, PDF and ePub downloads, according to the available data) and Abstracts Views on Vision4Press platform.
Data correspond to usage on the plateform after 2015. The current usage metrics is available 48-96 hours after online publication and is updated daily on week days.
Initial download of the metrics may take a while.