Fig. 11
Download original image
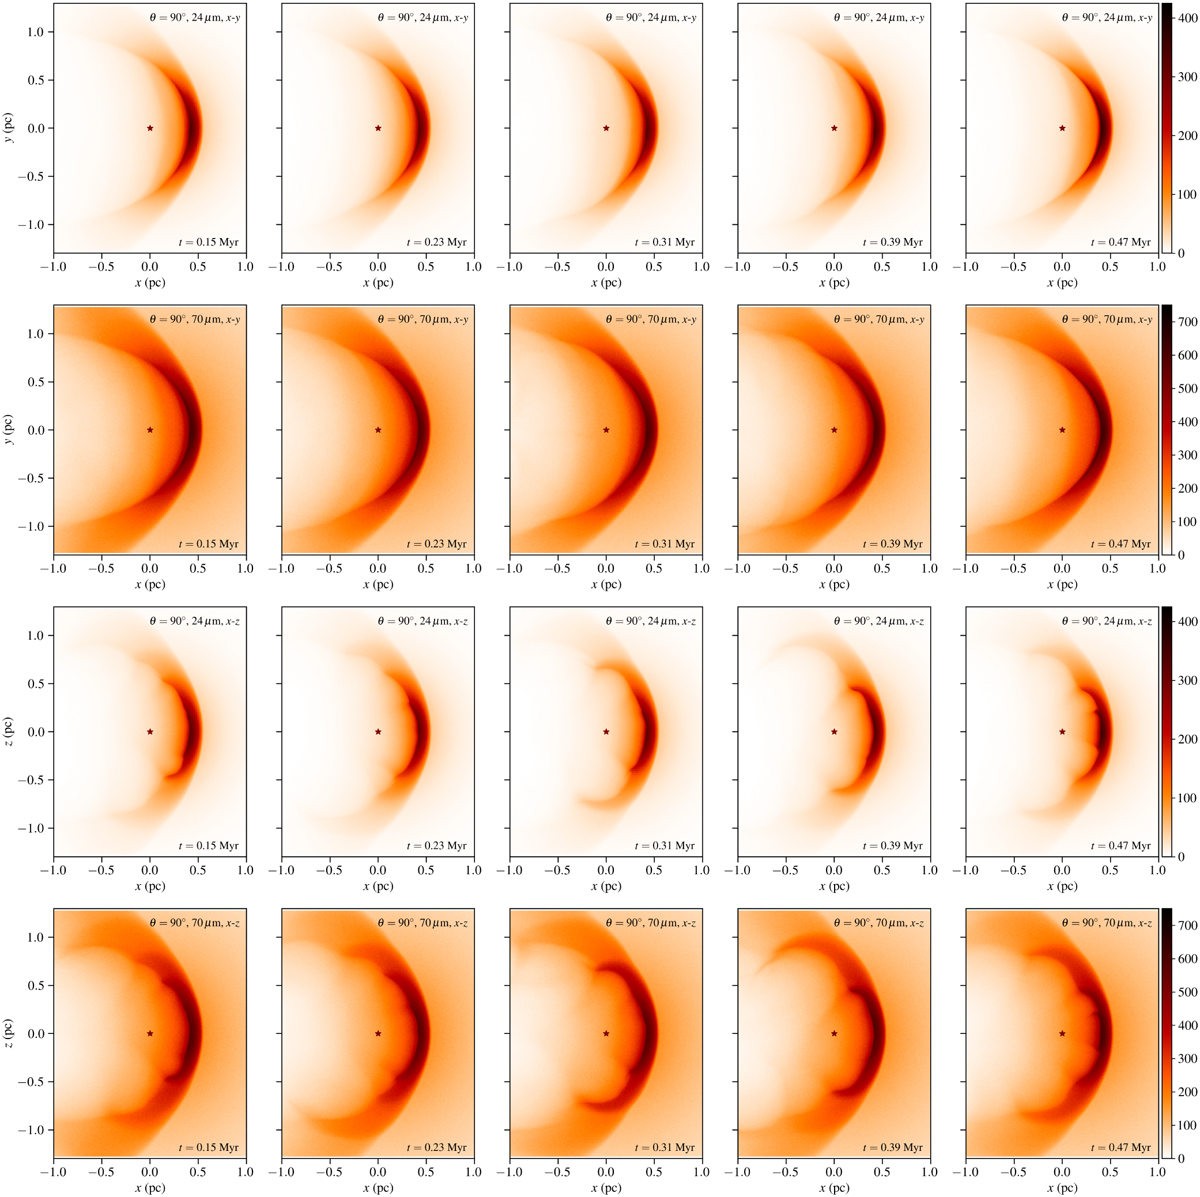
Infrared dust emission from a time series of snapshots for 3D-3-by7 showing, from top to bottom, respectively, 24 µm emission for projection along ẑ, 70 µm emission for projection along ẑ, 24 µm emission for projection along ŷ and 70 µm emission for projection along ŷ. The linear colour scale is in units of MJy ster−1, and note that the two different observation wavelengths have different colour scales. Snapshots are shown from left to right ever 0.08 Myr from 0.15 Myr to 0.47 Myr. The star symbol shows the location of the star at the origin.
Current usage metrics show cumulative count of Article Views (full-text article views including HTML views, PDF and ePub downloads, according to the available data) and Abstracts Views on Vision4Press platform.
Data correspond to usage on the plateform after 2015. The current usage metrics is available 48-96 hours after online publication and is updated daily on week days.
Initial download of the metrics may take a while.