Fig. A.1.
Download original image
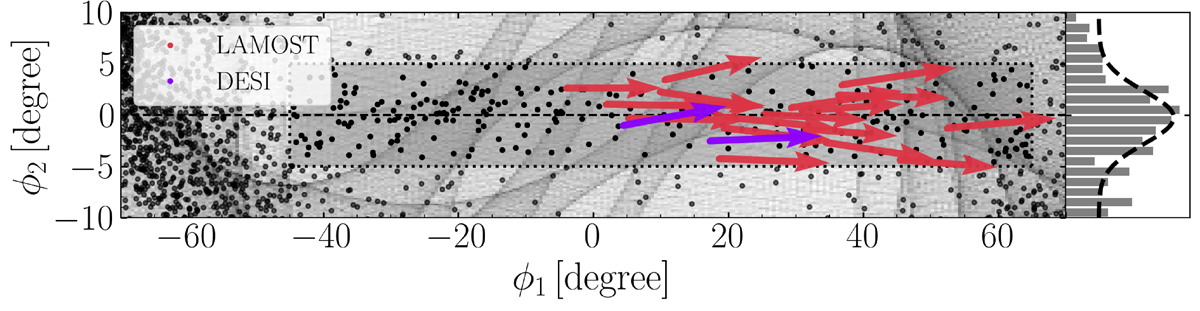
The sky distribution of the stars in the new coordinates is showed in the left panel. The shadow region represents the coverage of the new stream with −45° < ϕ1 < 65° and |ϕ2|< 5°. The stars with arrows represent the stars with RV from LAMOST (red) and DESI (magenta). The arrows represent the tangential velocities with Solar motion corrected. The right panel shows the number distribution of the stars along the latitude ϕ2 with longitude −45° < ϕ1 < 65°. The dashed line represents the fitting results with a Gaussian distribution.
Current usage metrics show cumulative count of Article Views (full-text article views including HTML views, PDF and ePub downloads, according to the available data) and Abstracts Views on Vision4Press platform.
Data correspond to usage on the plateform after 2015. The current usage metrics is available 48-96 hours after online publication and is updated daily on week days.
Initial download of the metrics may take a while.