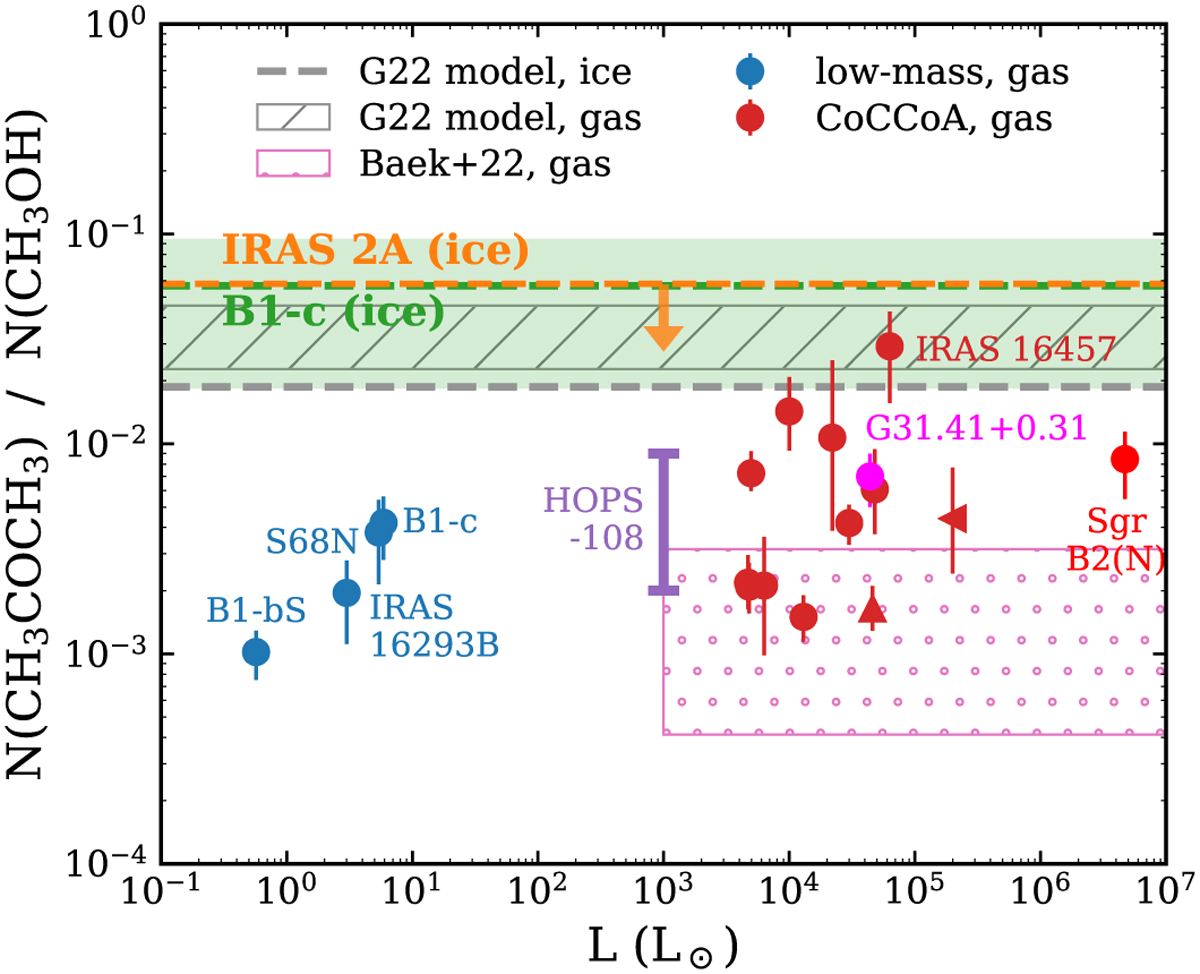
Fig. 6
Download original image
Column density ratios between acetone and methanol. The gas-phase ratios of low-, intermediate-, and high-mass sources are shown in blue, purple, and red points, respectively. The upward- and leftward-pointing triangles correspond to G34.30+0.20 (lower limit of the acetone-to-methanol ratio, see the last paragraph of Sect. 5.2) and NGC 6334-38 (upper limit of luminosity, see Table 1), respectively. The ice ratios two low-mass sources, B1-c and IRAS 2A, are indicated by dashed lines in green and orange, respectively. Since acetone ice is only considered as tentatively detected in IRAS 2A, the uncertainty is indicated by a green-shaded region only for B1-c. For the high-mass sample of Baek et al. (2022), only a range is displayed since no luminosity information is provided. The dashed line and hatched region in gray indicate the modeling results of the MAGICKAL astrochemical simulations in Belloche et al. (2022); the model is originally introduced in Garrod et al. (2022), hence abbreviated as G22 in the legend.
Current usage metrics show cumulative count of Article Views (full-text article views including HTML views, PDF and ePub downloads, according to the available data) and Abstracts Views on Vision4Press platform.
Data correspond to usage on the plateform after 2015. The current usage metrics is available 48-96 hours after online publication and is updated daily on week days.
Initial download of the metrics may take a while.