Fig. 5
Download original image
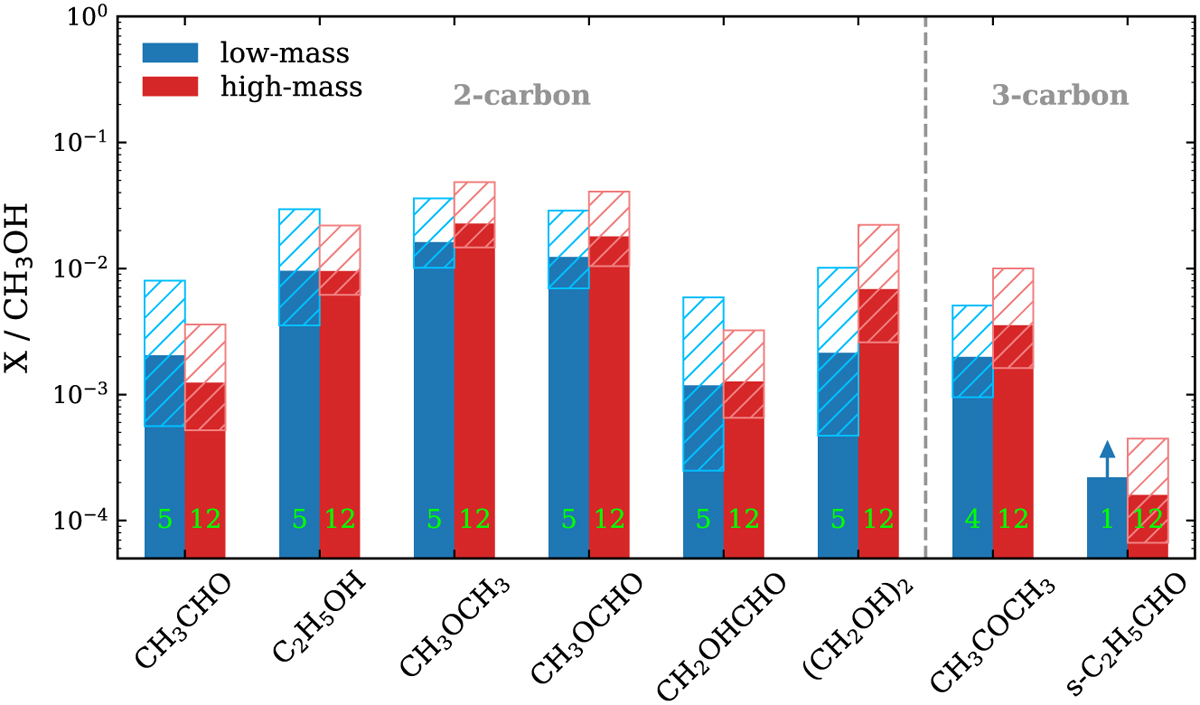
Column density ratios of six two-carbon and two three-carbon O-COMs with respect to methanol in low-mass (blue) and high-mass (red) protostars. The hatched regions indicate the standard deviation weighted by the uncertainties on log scales. The sample size (i.e., the number of sources) is labeled at the bottom of each bar in green. The column density of s-propanal was only measured in one low-mass source (IRAS 16293-2243 B), and its methanol column density was not measured at the same location as s-propanal but closer to the continuum peak, which generally has higher column densities; therefore the calculated ratio between propanal and methanol of this source is considered as lower limit.
Current usage metrics show cumulative count of Article Views (full-text article views including HTML views, PDF and ePub downloads, according to the available data) and Abstracts Views on Vision4Press platform.
Data correspond to usage on the plateform after 2015. The current usage metrics is available 48-96 hours after online publication and is updated daily on week days.
Initial download of the metrics may take a while.