Fig. 4
Download original image
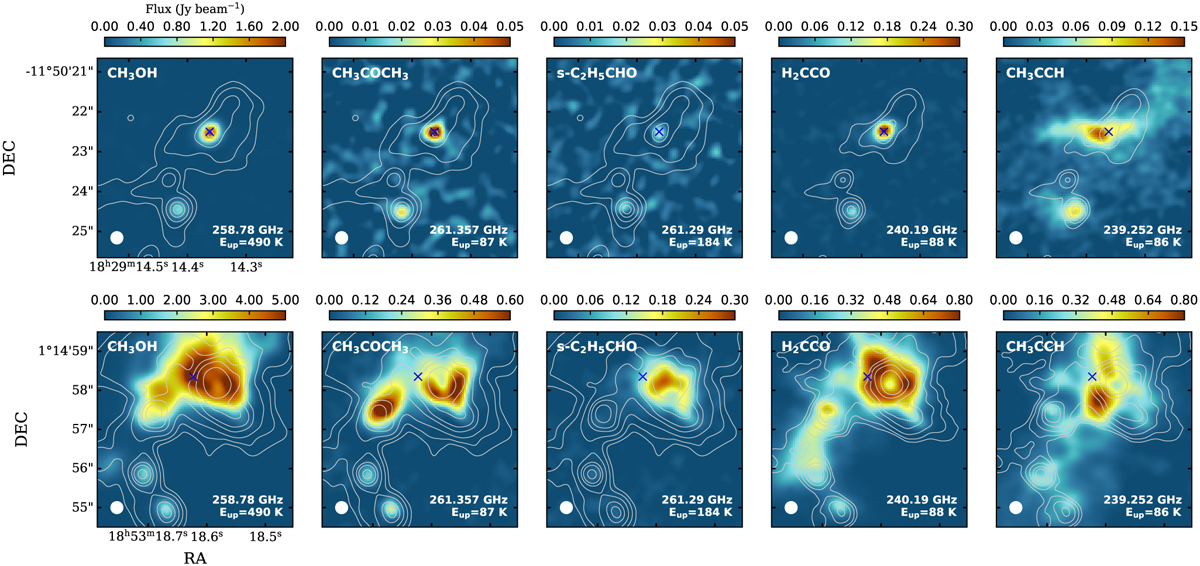
Moment 0 maps of the methanol, acetone, propanal, ketene, and propyne emission in G19.88-0.53 and G34.30+0.20. In each panel, the rest frequency and the upper energy level of the corresponding line is annotated in the bottom right corner, and the beam size is indicated in the bottom left corner. Contours in gray denote the 3, 5, 10, and 20σ levels of the continuum emission at 258.465 GHz (~1.16 mm), where σ = 0.03 Jy beam−1. The continuum maps are displayed in Fig. 1 of C23. The location where the ALMA spectrum was extracted is indicated by a blue cross in each panel.
Current usage metrics show cumulative count of Article Views (full-text article views including HTML views, PDF and ePub downloads, according to the available data) and Abstracts Views on Vision4Press platform.
Data correspond to usage on the plateform after 2015. The current usage metrics is available 48-96 hours after online publication and is updated daily on week days.
Initial download of the metrics may take a while.