Fig. A.2
Download original image
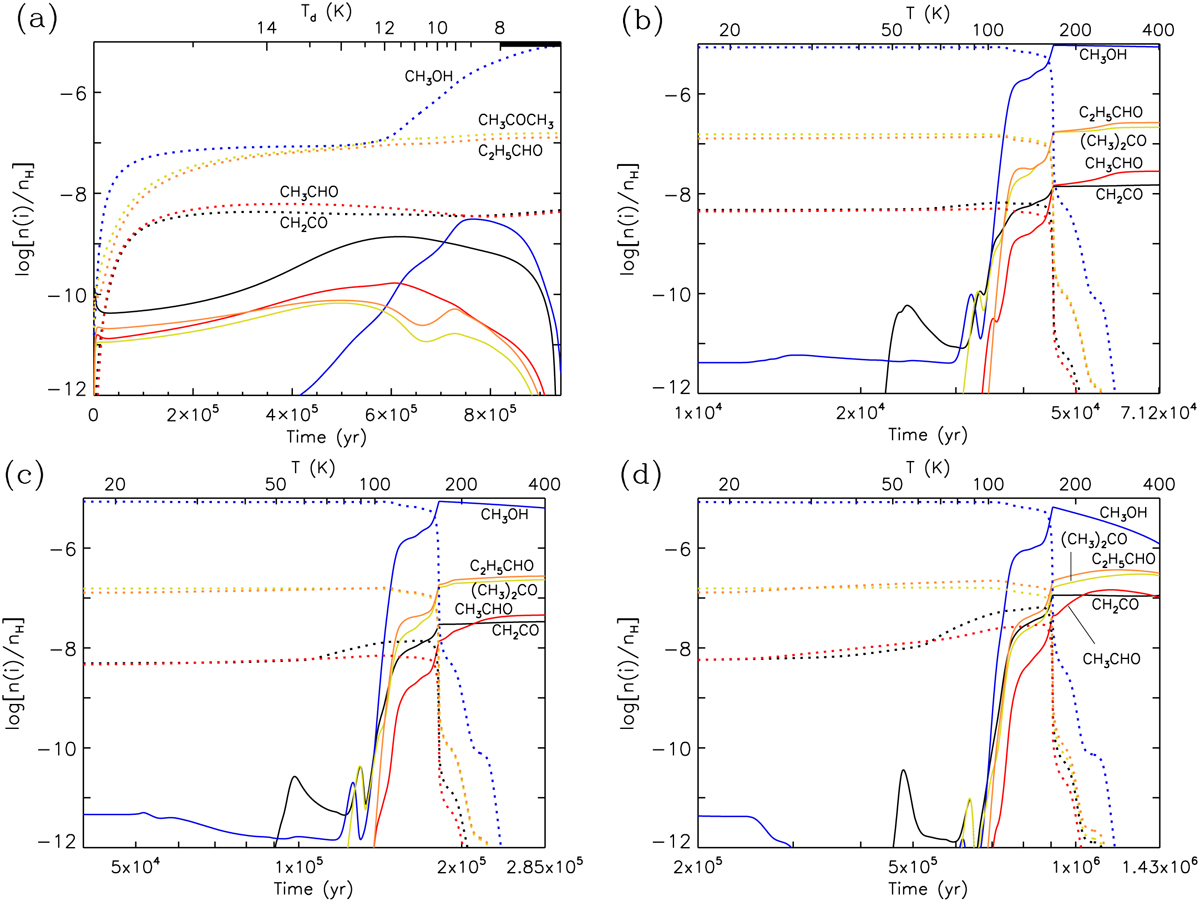
Abundances of CH3OH (blue), CH2CO (black), CH3CHO (red), CH3COCH3 (yellow), and C2H5CHO (orange) with respect to total H abundance during the collapse stage (a) and subsequent warm-up stage with fast (b), medium (c), and slow (d) timescales. The corresponding temperatures are indicated by the upper x-axis in each panel. The abundances in the gas phase and the solid phase are plotted in solid and dashed lines, respectively. The intersection of the solid and dashed lines in the same color (i.e., ice and gas abundances of the same species) corresponds to the sublimation of this species from ice to gas.
Current usage metrics show cumulative count of Article Views (full-text article views including HTML views, PDF and ePub downloads, according to the available data) and Abstracts Views on Vision4Press platform.
Data correspond to usage on the plateform after 2015. The current usage metrics is available 48-96 hours after online publication and is updated daily on week days.
Initial download of the metrics may take a while.