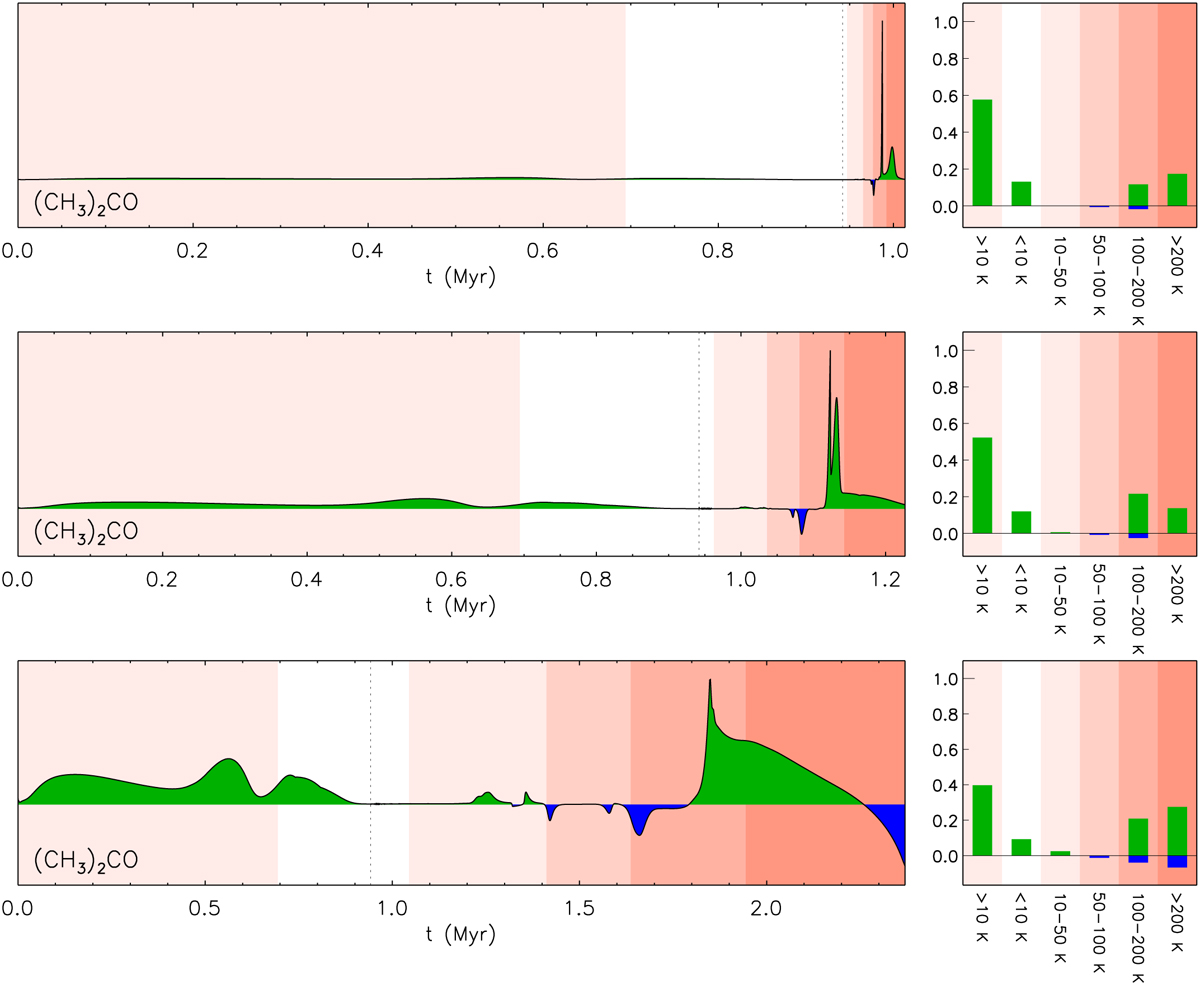
Fig. A.1
Download original image
Net rate of change (arbitrary units) of acetone abundance as a function of time simulated by MAGICKAL. Here an updated version of MAGICKAL used in (Belloche et al. 2022) is applied. The three rows from top to bottom correspond to the simulations with a fast (5 × 10⁴ yr), medium (2 × 10⁵ yr), and slow (1 × 10⁶ yr) warm-up stage, respectively. In each of the left panels, the vertical dotted line indicate the start of the warm-up stage. The panels on the right side show the net rates of change that are normalized and integrated over each temperature range.
Current usage metrics show cumulative count of Article Views (full-text article views including HTML views, PDF and ePub downloads, according to the available data) and Abstracts Views on Vision4Press platform.
Data correspond to usage on the plateform after 2015. The current usage metrics is available 48-96 hours after online publication and is updated daily on week days.
Initial download of the metrics may take a while.