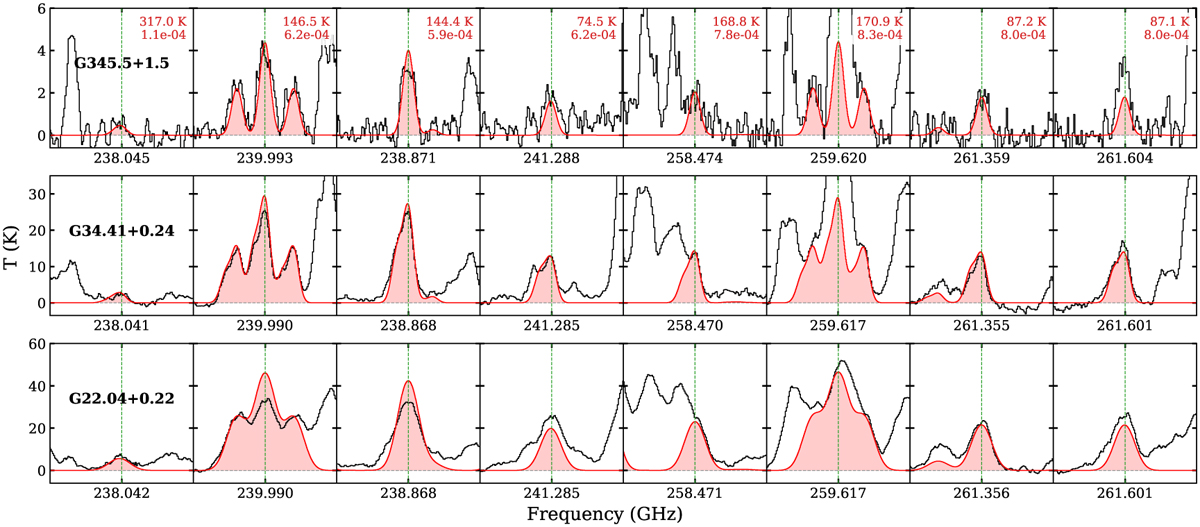
Fig. 1
Download original image
Best-fit LTE models of acetone spectra (red) at eight strong transitions overlaid on the ALMA spectrum of three example sources in CoCCoA (black). The upper energy levels and Einstein A coefficients are annotated in red text in the upper right. On the x-axis, only the central frequency of each line is labeled, but the velocity span of each panel is fixed at [−15, +15] km s−1.
Current usage metrics show cumulative count of Article Views (full-text article views including HTML views, PDF and ePub downloads, according to the available data) and Abstracts Views on Vision4Press platform.
Data correspond to usage on the plateform after 2015. The current usage metrics is available 48-96 hours after online publication and is updated daily on week days.
Initial download of the metrics may take a while.