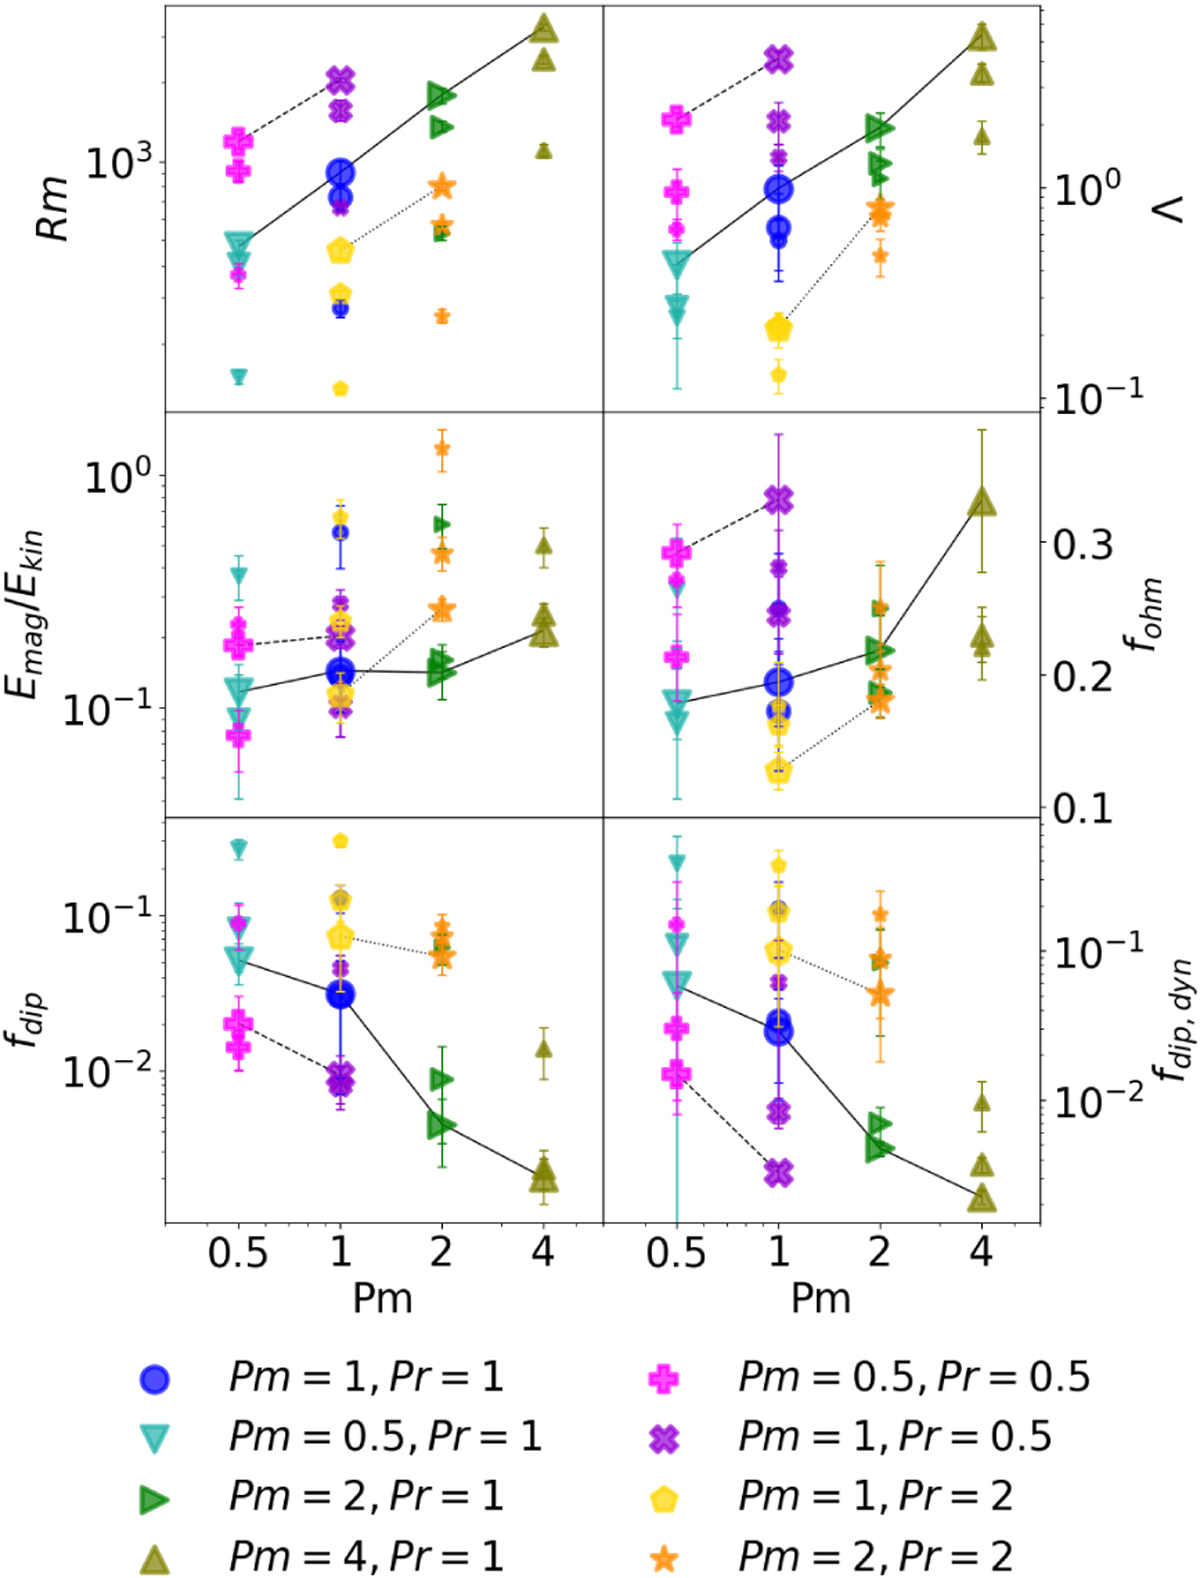
Fig. 9
Download original image
Same diagnostics as in Fig. 5, shown as a function of Pm, with different values of Pr. The decreasing size of the mark indicates the increase in age (0.5, 1, and 10 Gyr). The colors and shapes help to distinguish the evolutionary changes and are the same as in Figs. 10 and 11. The lines of constant Pr were added for the 0.5 Gyr models.
Current usage metrics show cumulative count of Article Views (full-text article views including HTML views, PDF and ePub downloads, according to the available data) and Abstracts Views on Vision4Press platform.
Data correspond to usage on the plateform after 2015. The current usage metrics is available 48-96 hours after online publication and is updated daily on week days.
Initial download of the metrics may take a while.