Fig. 8
Download original image
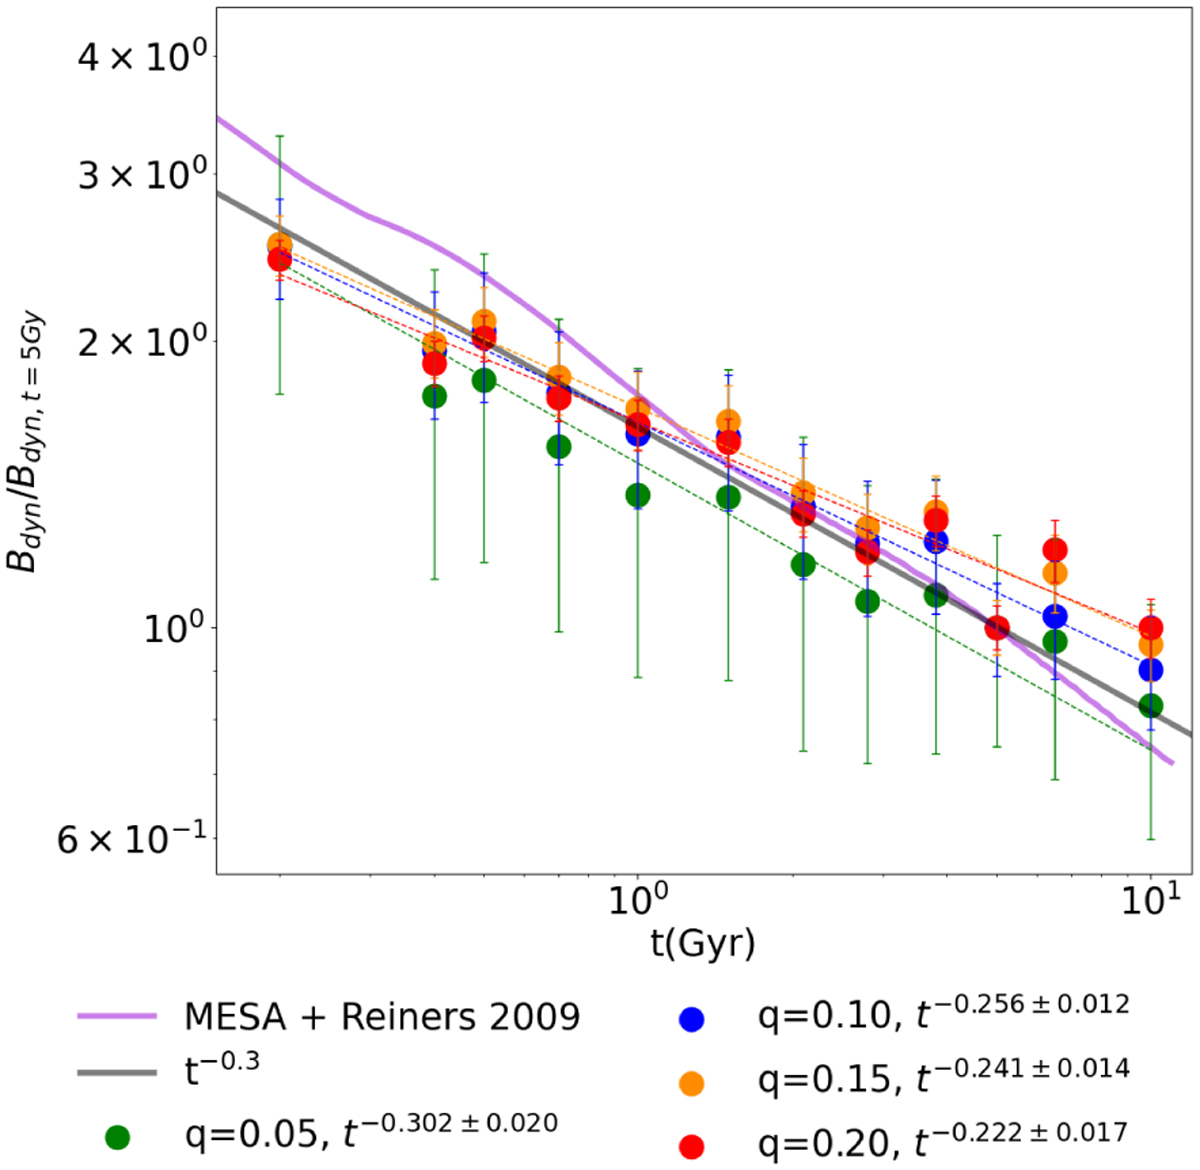
Evolution of the magnetic field strength at the dynamo surface averaged in time, using the scaling laws and calculating the average value of the magnetic field over different relative thicknesses q, around rm (green, blue, orange, and red). The error bars are associated with the radial variation and are larger for thinner integration shells over which we evaluated Eq. (18). The dotted lines show the corresponding best-fit power laws. The solid lines indicate Eq. (15) applied to our MESA output (pink), and the prediction by Reiners & Christensen (2010) (gray).
Current usage metrics show cumulative count of Article Views (full-text article views including HTML views, PDF and ePub downloads, according to the available data) and Abstracts Views on Vision4Press platform.
Data correspond to usage on the plateform after 2015. The current usage metrics is available 48-96 hours after online publication and is updated daily on week days.
Initial download of the metrics may take a while.