Fig. 3
Download original image
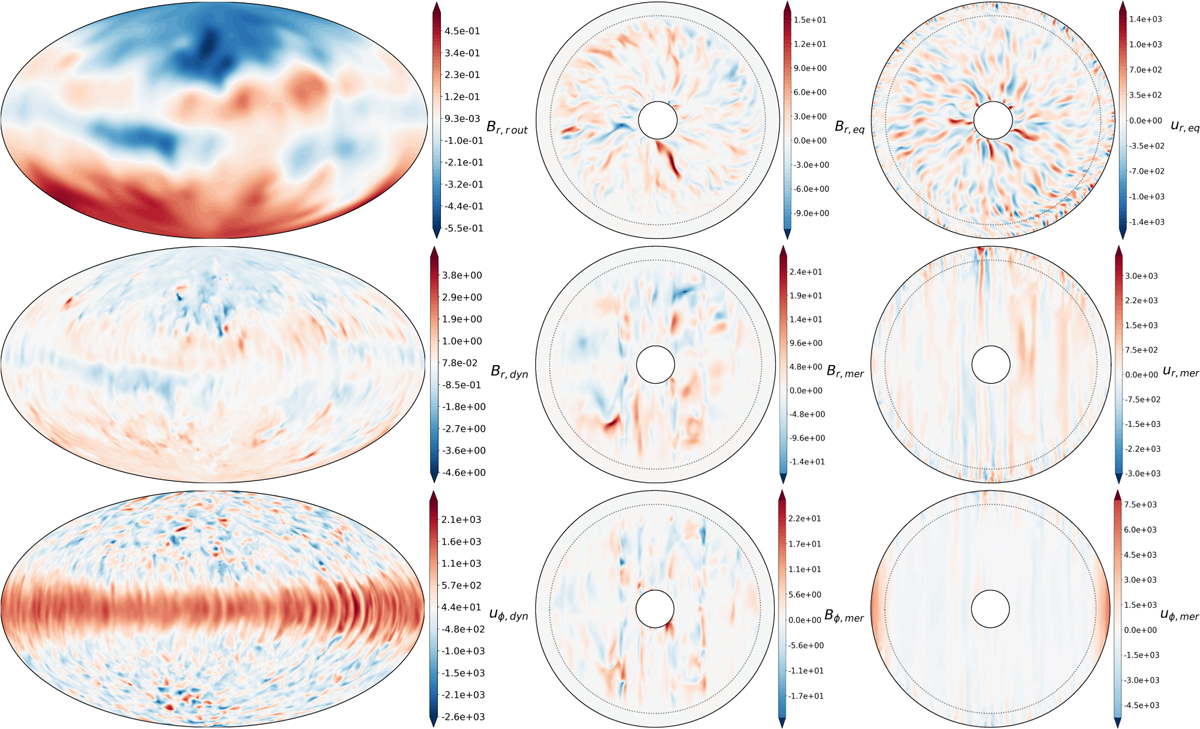
Snapshots of the saturated solution for the representative 1 MJ 1 Gyr model. Left column: maps of Br at the outermost layer of our domain, Br at r = rm, uφ at r = rm, from top to bottom. Center: equatorial slice of Br, meridional slice of Br, and meridional slice of Bφ. Right: equatorial slice of ur, meridional slice of ur, and meridional slice of uφ. In the central and right panels, the location of rm is marked with dotted gray lines in the equatorial and meridional cuts. The color bars indicate the values in code units.
Current usage metrics show cumulative count of Article Views (full-text article views including HTML views, PDF and ePub downloads, according to the available data) and Abstracts Views on Vision4Press platform.
Data correspond to usage on the plateform after 2015. The current usage metrics is available 48-96 hours after online publication and is updated daily on week days.
Initial download of the metrics may take a while.