Fig. 1
Download original image
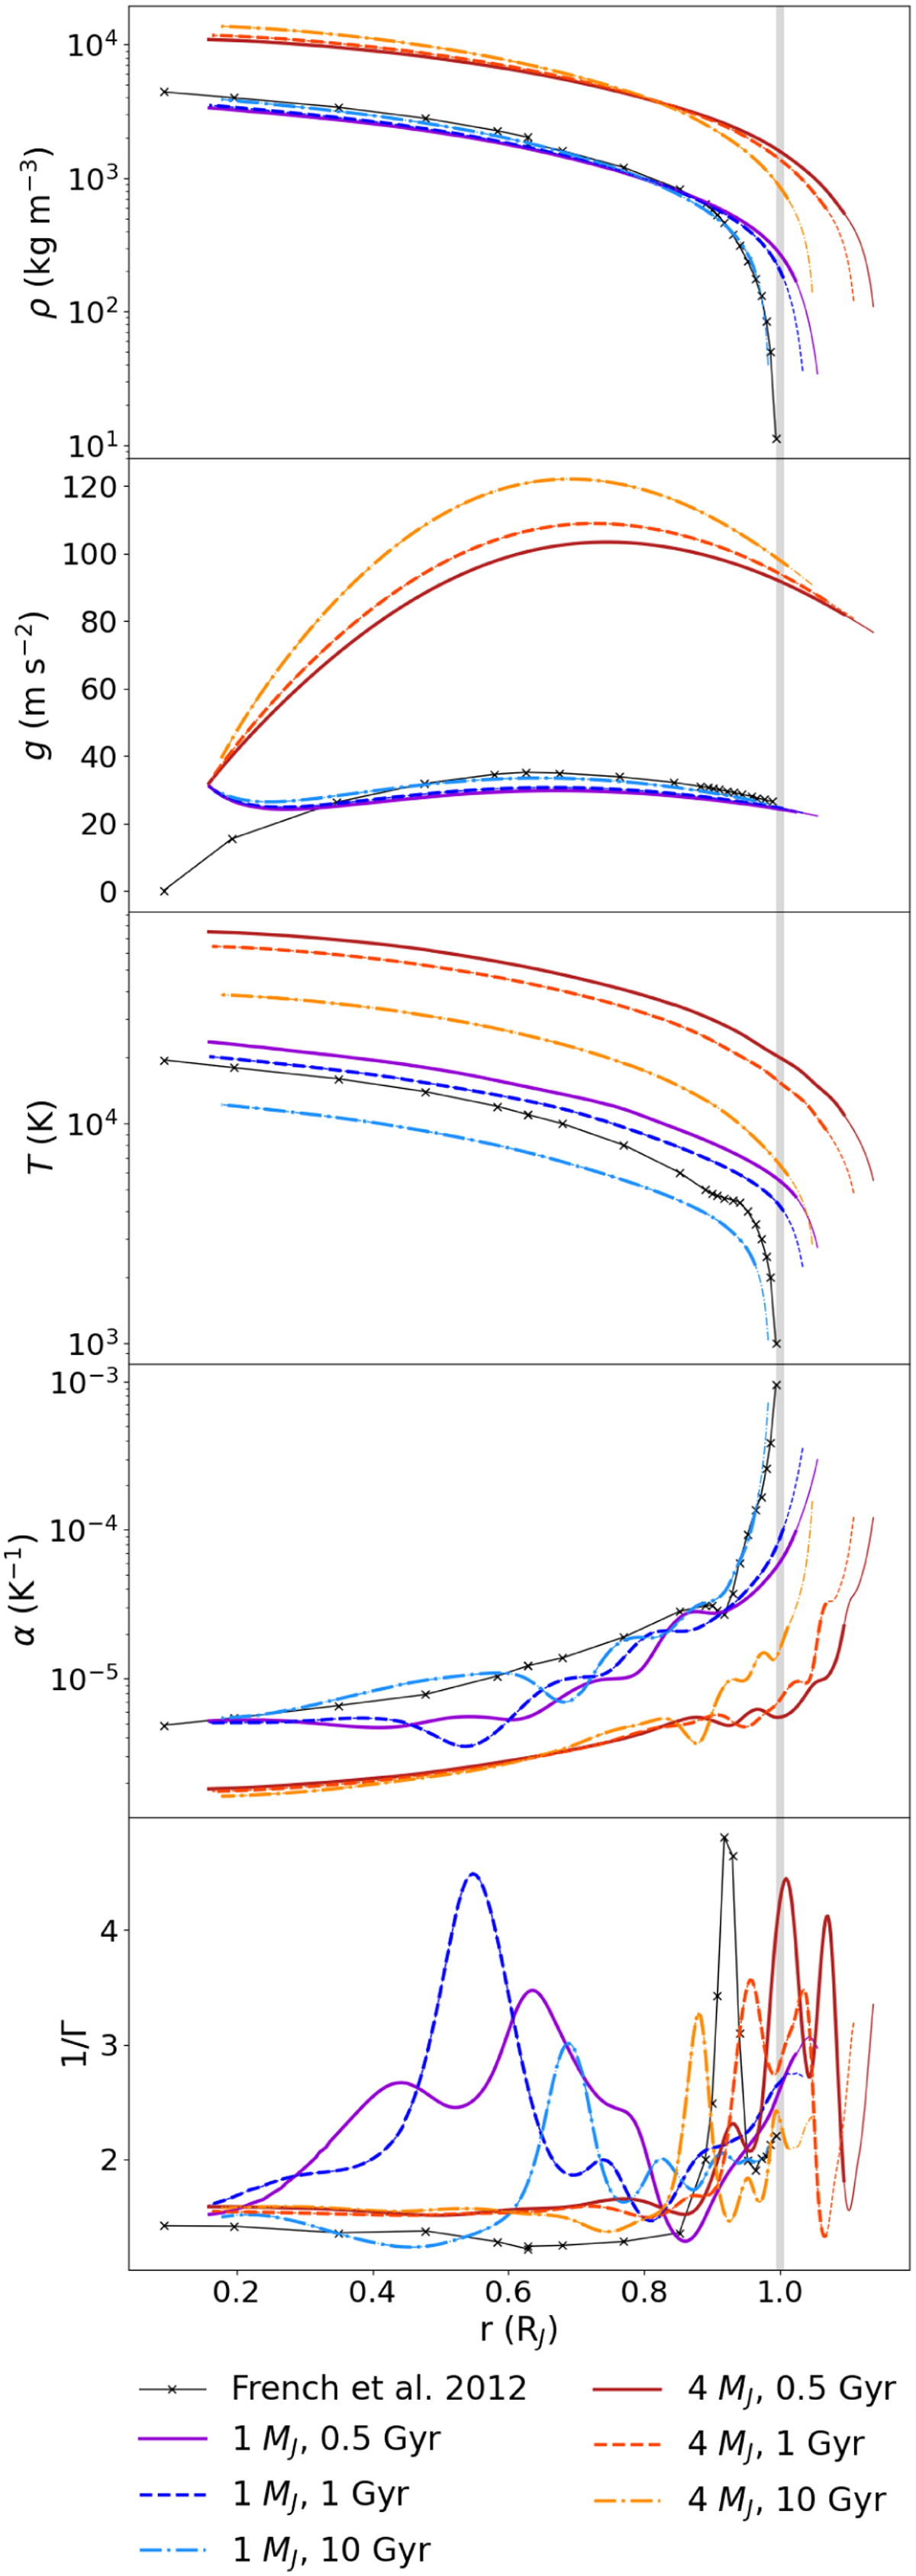
MESA hydrostatic profiles of 1 and 4 MJ at different evolutionary times, cut at an outer density ≈100 times (thin extended lines) or ≈20 times (thick lines only) that is lower than the innermost radius of the isentropic shell, just outside the core-envelope boundary. The gray lines show the Jovian values according to the popular French et al. (2012) model, and the vertical gray band reflects the current Jovian radius as a reference. From top to bottom: density ρ(r), temperature T(r), gravity g(r), thermal expansion coefficient α(r), and the inverse of the Grüneisen parameter Γ(r).
Current usage metrics show cumulative count of Article Views (full-text article views including HTML views, PDF and ePub downloads, according to the available data) and Abstracts Views on Vision4Press platform.
Data correspond to usage on the plateform after 2015. The current usage metrics is available 48-96 hours after online publication and is updated daily on week days.
Initial download of the metrics may take a while.