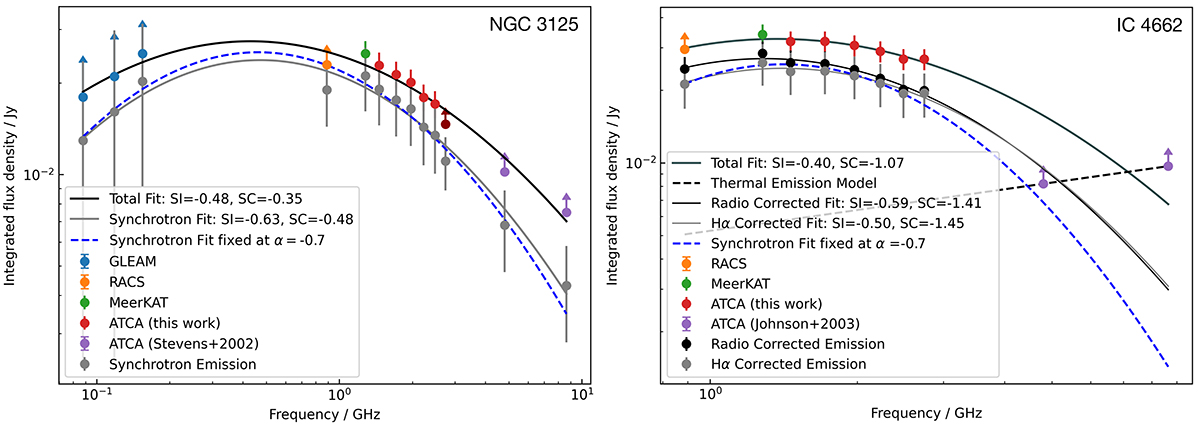
Fig. 7.
Download original image
Spectral energy distribution of NGC 3125 (left panel) and IC 4662 (right panel). The plot displays total intensity data with different observations: GLEAM in blue, RACS in orange, MeerKAT in green, ATCA data from this study in red, and high-frequency data from ATCA for NGC 3125 (Stevens et al. 2002) and for IC 4662 (Johnson et al. 2002) in violet. As GLEAM and RACS are survey data, we only use lower limits as we expect more flux to be there. Additionally, for NGC 3125 there may be some flux loss at 2740 MHz. Therefore, the data point marked in dark red and shown as a lower limit, does not contribute to the fit. Thermally corrected emissions are shown in gray. Additionally, the polynomial fits from Perley & Butler (2017) are provided, indicating the spectral index α0 (SI) and spectral curvature β (SC) of the source. A standard synchrotron spectrum fit with a spectral index of α = −0.7 is shown in blue. For IC 4662, we additionally present a thermal radio corrected emission in black by assuming only thermal emission above 4.86 GHz and using the black dashed line as new thermal emission model. The 4.8 and 8.64 GHz data points for IC 4662 are excluded from the fit.
Current usage metrics show cumulative count of Article Views (full-text article views including HTML views, PDF and ePub downloads, according to the available data) and Abstracts Views on Vision4Press platform.
Data correspond to usage on the plateform after 2015. The current usage metrics is available 48-96 hours after online publication and is updated daily on week days.
Initial download of the metrics may take a while.