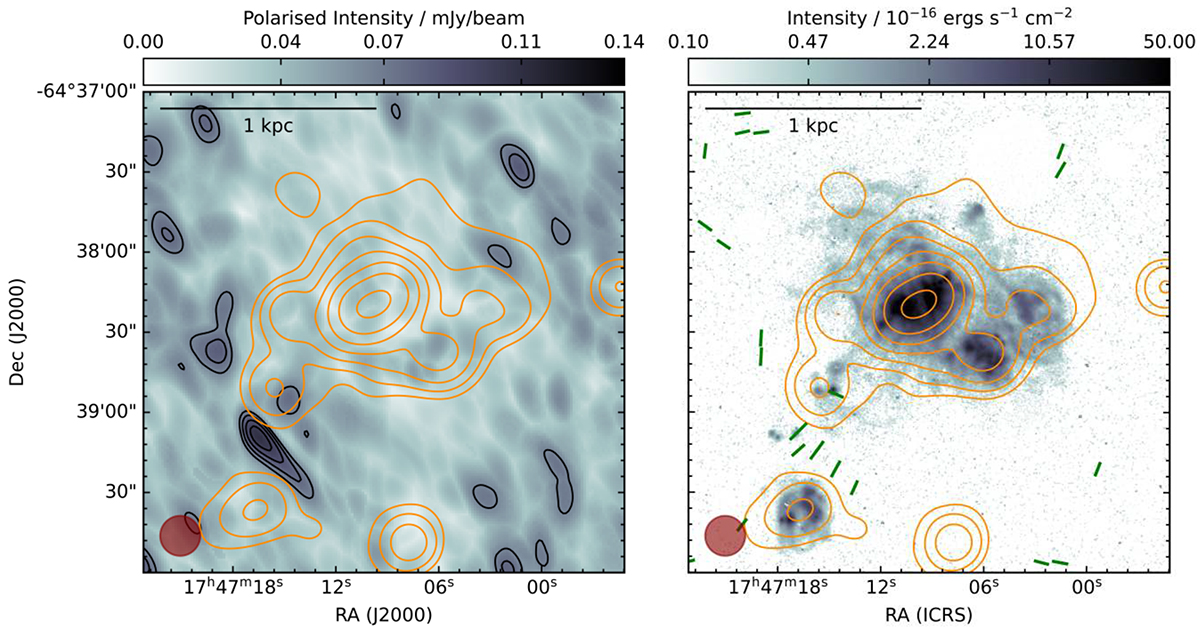
Fig. 11.
Download original image
Left: Polarised intensity of IC 4662. The black contours show 5σ increasing with a factor of 1.5 plus the mean of the background (σ = 4.5 μJy/beam and mean = 42.2 μJy/beam) of the polarised emission. The orange contours show 5σ increasing with a factor of 2 (σ = 25 μJy/beam) of the total radio intensity. Right: Hα map of IC 4662 with total radio emission contours at 3σ, increasing by a factor of two (σ = 40 μJy/beam), overlaid. The magnetic field orientations are shown in green. The circular beam of 15″ is shown in the left corner.
Current usage metrics show cumulative count of Article Views (full-text article views including HTML views, PDF and ePub downloads, according to the available data) and Abstracts Views on Vision4Press platform.
Data correspond to usage on the plateform after 2015. The current usage metrics is available 48-96 hours after online publication and is updated daily on week days.
Initial download of the metrics may take a while.