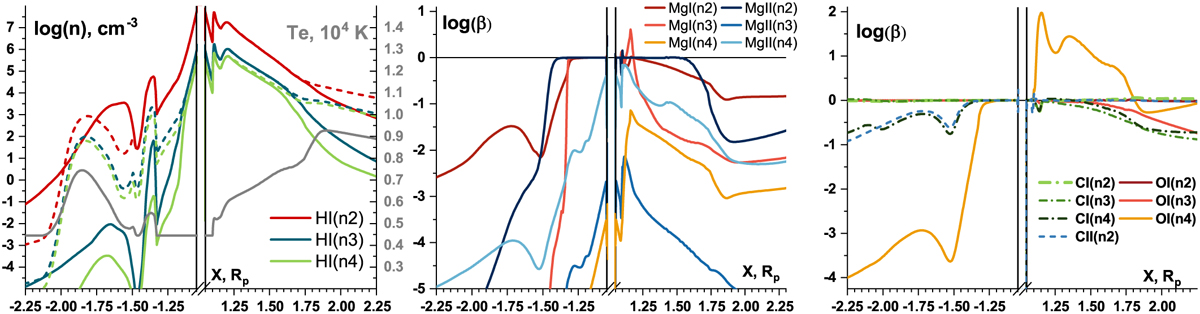
Fig. 7
Download original image
Population profiles of different levels along the planet-star line at the day side (x > 0) and at the night side (x < 0). The left panel shows the hydrogen densities calculated by model (solid) lines and the corresponding LTE values (dashed). The center and right panels show the levels’ profiles as beta-factors (i.e., density values normalized to LTE values) for Mg I, Mg II, and O I, C I, C II.
Current usage metrics show cumulative count of Article Views (full-text article views including HTML views, PDF and ePub downloads, according to the available data) and Abstracts Views on Vision4Press platform.
Data correspond to usage on the plateform after 2015. The current usage metrics is available 48-96 hours after online publication and is updated daily on week days.
Initial download of the metrics may take a while.