Open Access
Fig. 6
Download original image
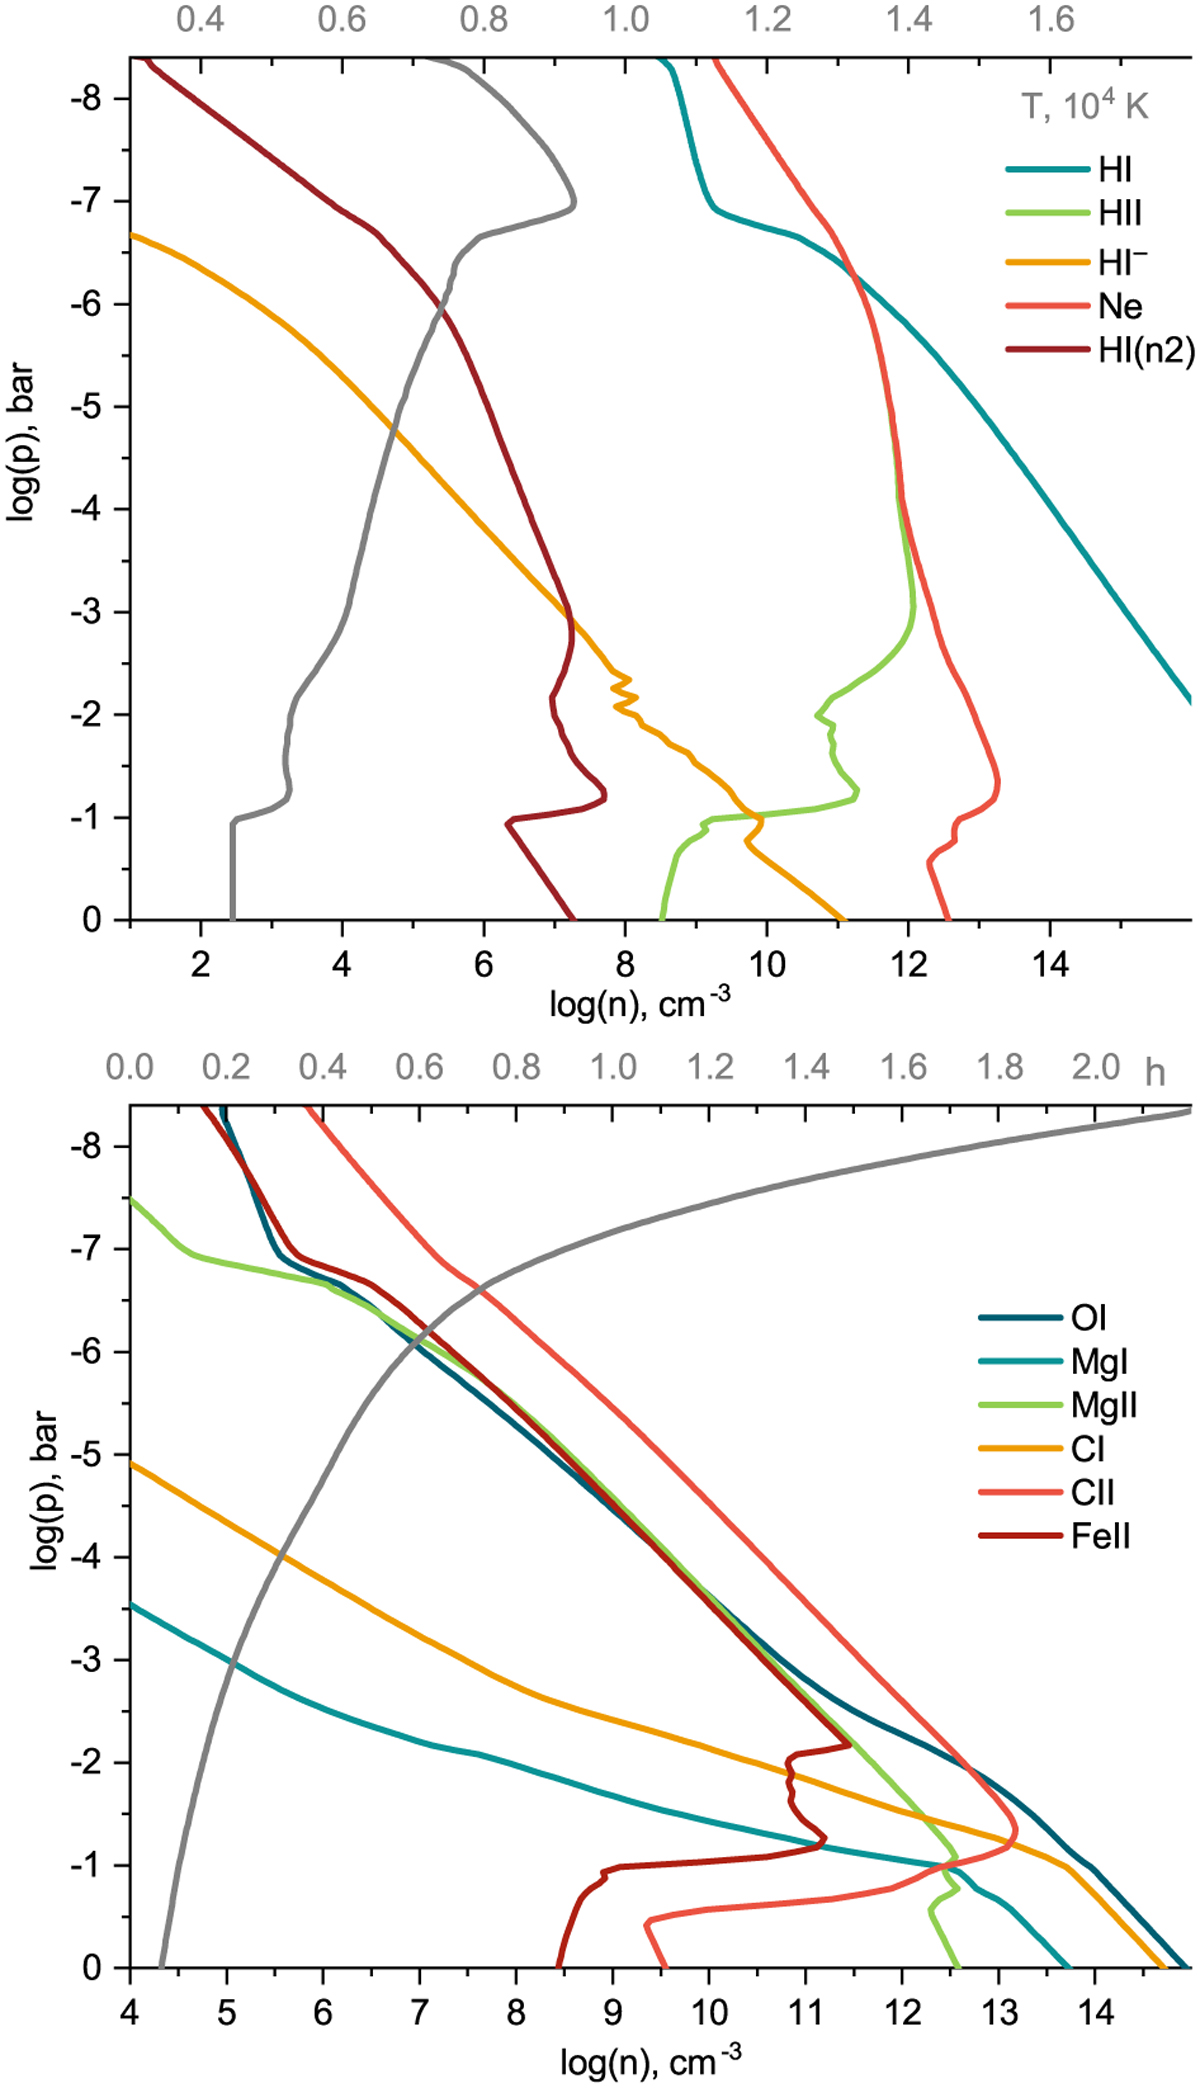
Density profiles of different elements along the planet-star line (x > 0 spatial axis, expressed in units of pressure). The gray line with the upper horizontal axis shows the temperature (top panel) and the height above the planet h = R/Rp − 1 (bottom panel). Results are obtained with parameter set N5.
Current usage metrics show cumulative count of Article Views (full-text article views including HTML views, PDF and ePub downloads, according to the available data) and Abstracts Views on Vision4Press platform.
Data correspond to usage on the plateform after 2015. The current usage metrics is available 48-96 hours after online publication and is updated daily on week days.
Initial download of the metrics may take a while.