Fig. 5
Download original image
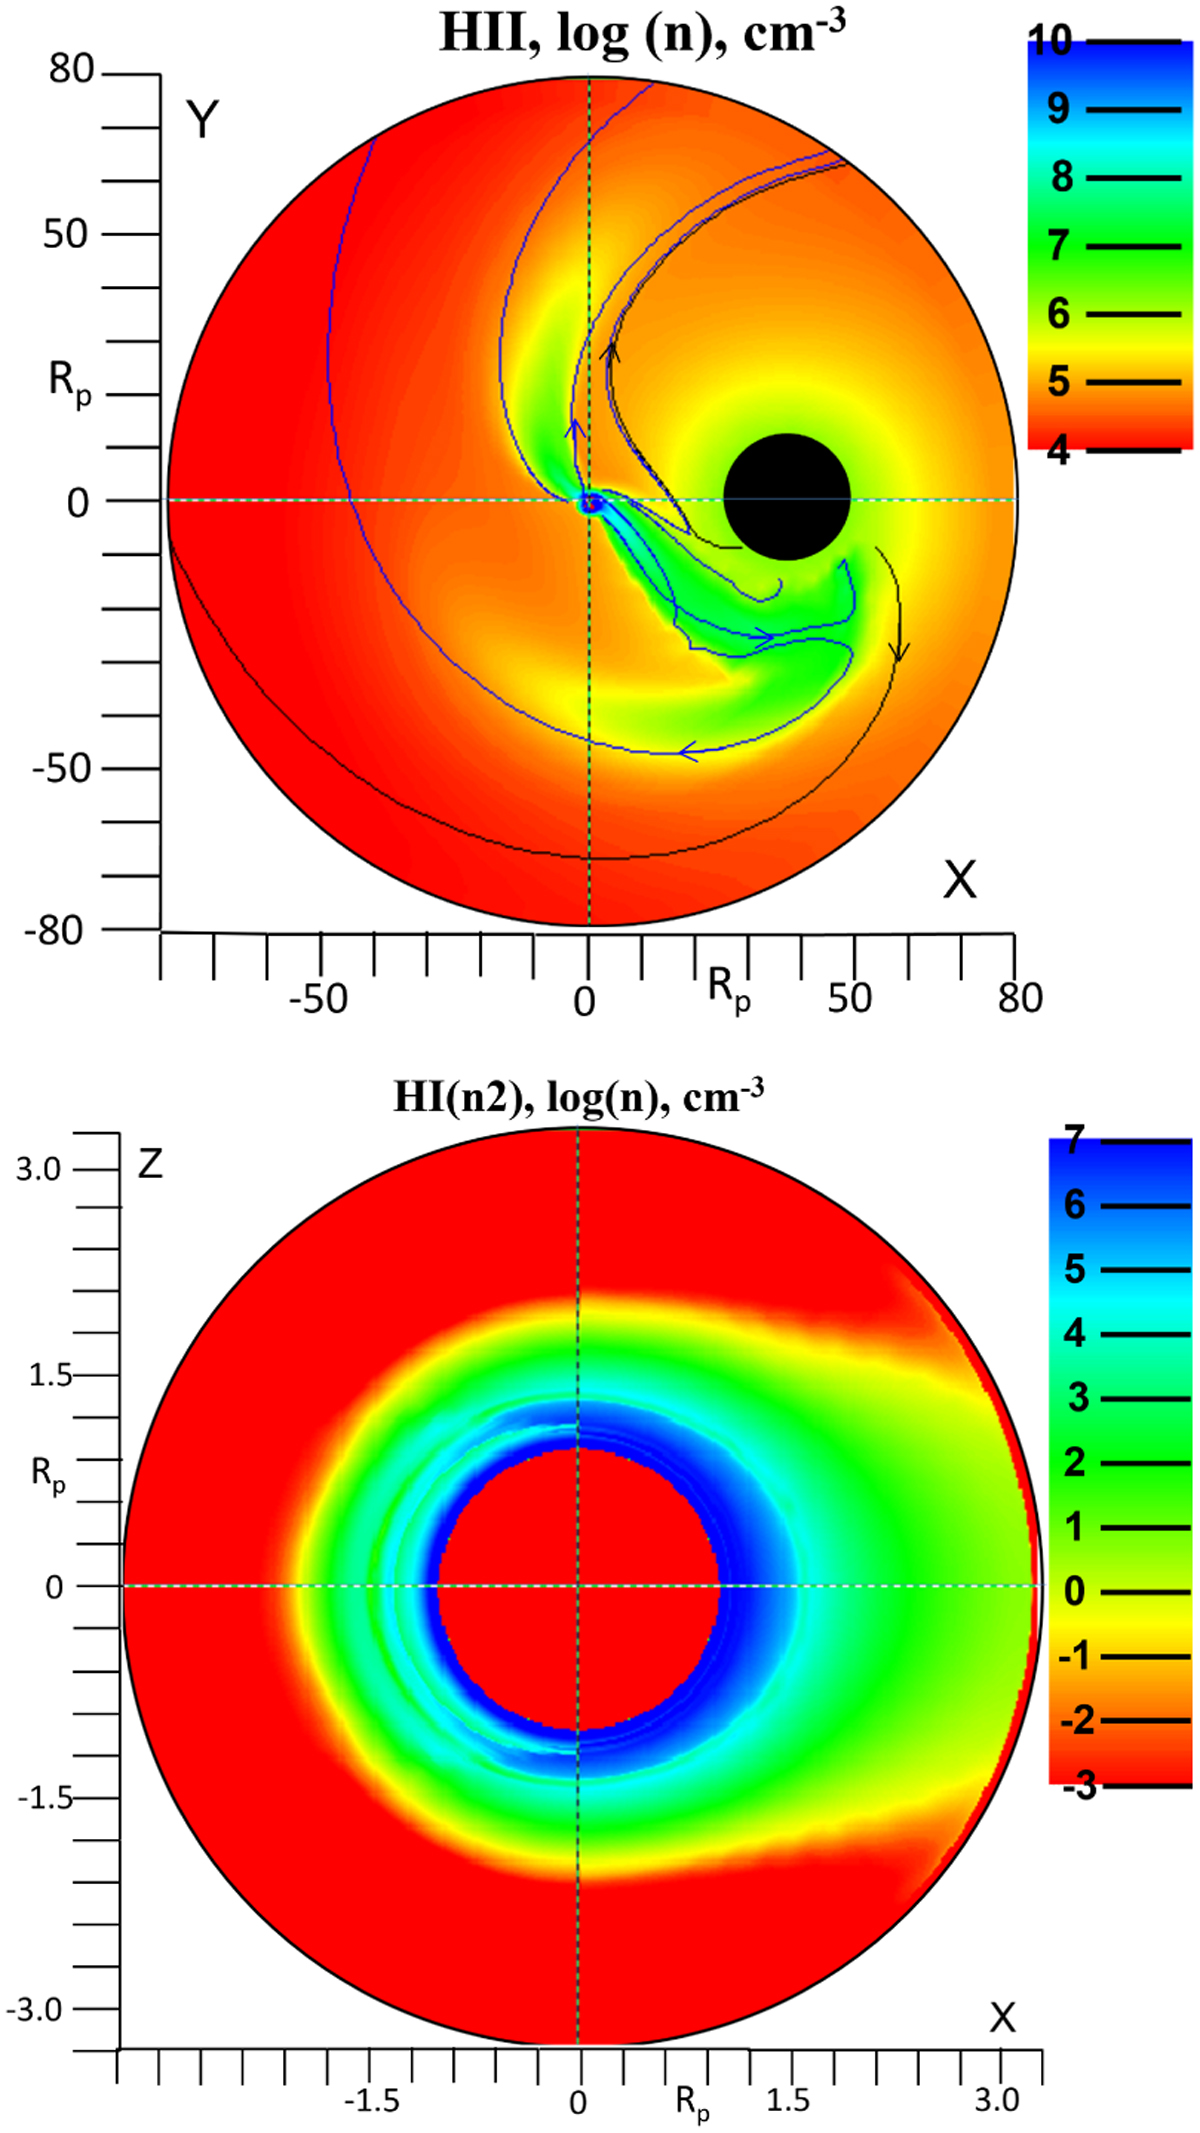
Top panel: distribution of the proton density in the equatorial plane of the KELT-9 stellar system (i.e., in the whole simulation domain) simulated with the fiducial parameter set N5. Black circle indicates the star in scale. The planet is located at the coordinate center. Streamlines are shown originating at the star (black lines), and at the planet (blue lines). Bottom panel: distribution of the excited hydrogen density in the meridional plane in close vicinity to KELT-9 b simulated with the parameter set N5. The scale of plots is in units of Rp. The values outside the specified variation ranges are colored either in red, if smaller than minimum, or in blue, if higher than maximum.
Current usage metrics show cumulative count of Article Views (full-text article views including HTML views, PDF and ePub downloads, according to the available data) and Abstracts Views on Vision4Press platform.
Data correspond to usage on the plateform after 2015. The current usage metrics is available 48-96 hours after online publication and is updated daily on week days.
Initial download of the metrics may take a while.