Fig. 2
Download original image
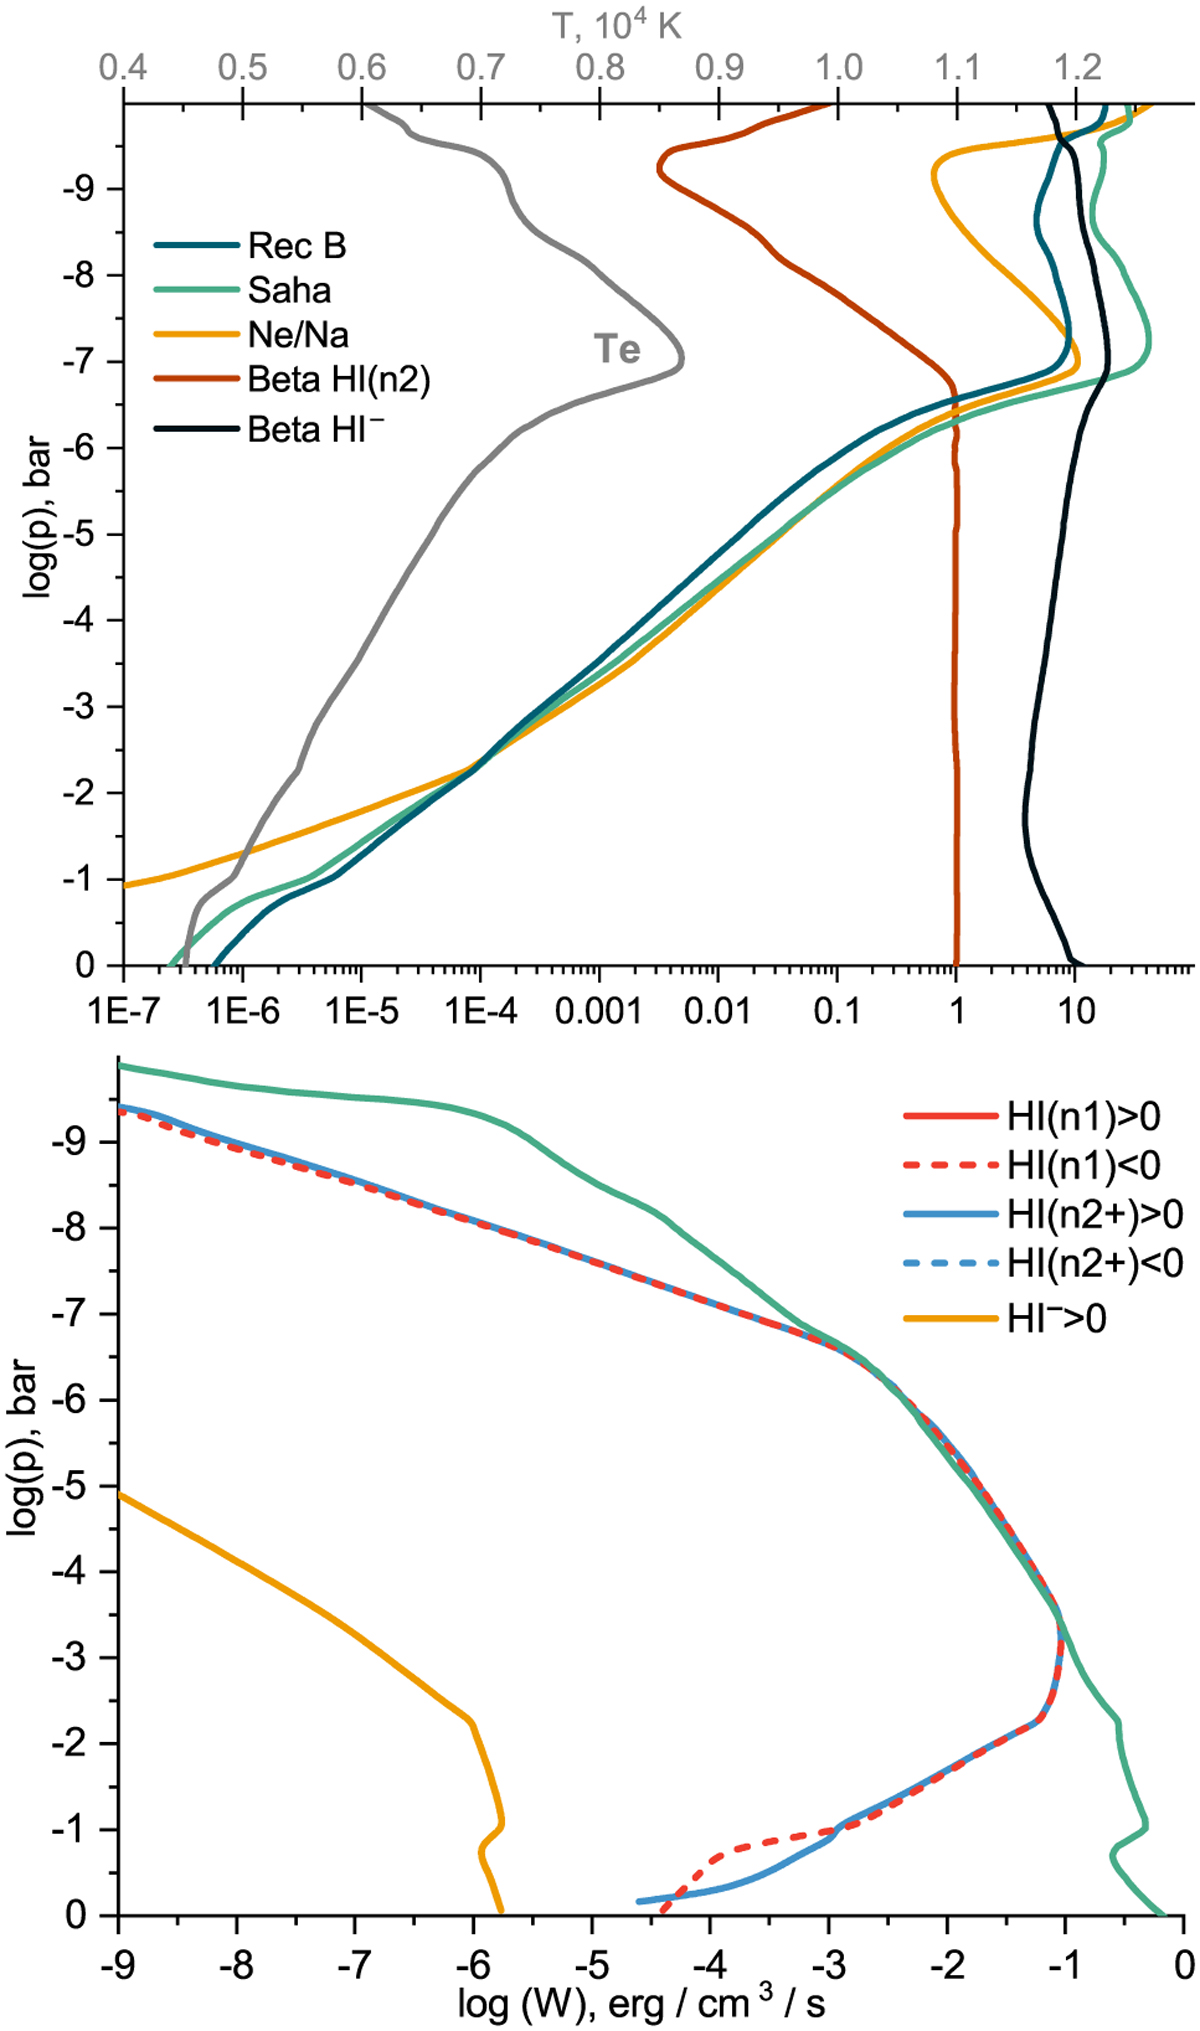
Profiles of various quantities of the H–He atmosphere of KELT-9 b along the y axis directed opposite to the orbital motion of the planet, obtained in simulation with the parameter set N 1 (Table 2 below) and expressed via pressure. Top panel: Population of H I(n2) level in terms of LTE value (red, left axis); ionization degree Ne/Na (orange) in comparison to Saha equilibrium (turquoise) and type B recombination (blue, formula (D.8)); temperature (gray, upper horizontal axis). Bottom panel: Heating (>0, solid lines) or cooling (<0, dashed lines) terms in the energy equation associated with H I(n1) and H I(n2) levels. Photoionization heating from the H I(n2) level given by the analytical formula ![]() is shown with a green line.
is shown with a green line.
Current usage metrics show cumulative count of Article Views (full-text article views including HTML views, PDF and ePub downloads, according to the available data) and Abstracts Views on Vision4Press platform.
Data correspond to usage on the plateform after 2015. The current usage metrics is available 48-96 hours after online publication and is updated daily on week days.
Initial download of the metrics may take a while.