Fig. 14
Download original image
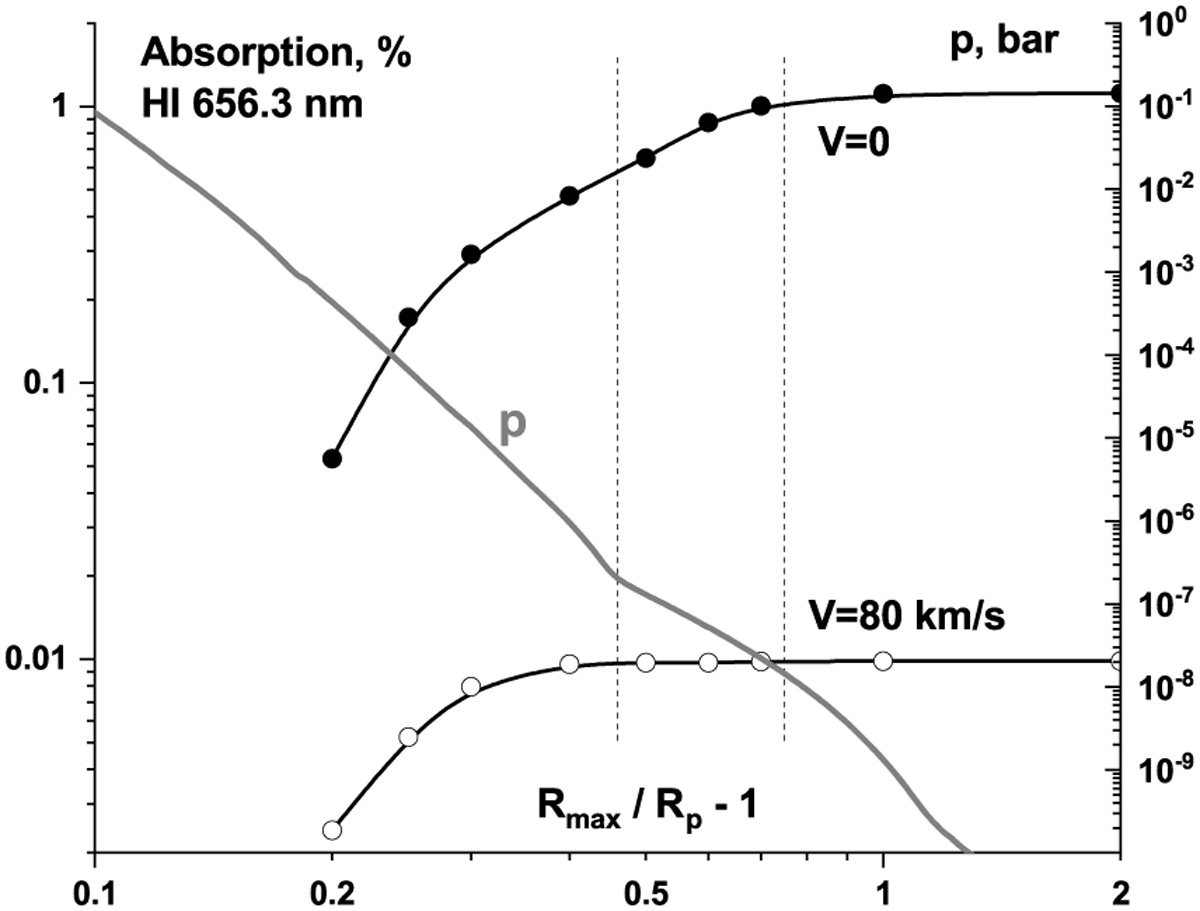
Absorption at the center of the Hα line (at V = 0, black circles) and at the distant wing (V = 80 km s−1, white circles), manually restricted by calculation within region Rp < r < Rmax around the planet, in dependence on Rmax. The vertical dashed lines show the region of formation of the corresponding absorption at V = 0 at the level of 0.5 to 0.9 of the maximum value. The gray curve shows the pressure in the atmosphere at the corresponding altitudes.
Current usage metrics show cumulative count of Article Views (full-text article views including HTML views, PDF and ePub downloads, according to the available data) and Abstracts Views on Vision4Press platform.
Data correspond to usage on the plateform after 2015. The current usage metrics is available 48-96 hours after online publication and is updated daily on week days.
Initial download of the metrics may take a while.