Fig. 9
Download original image
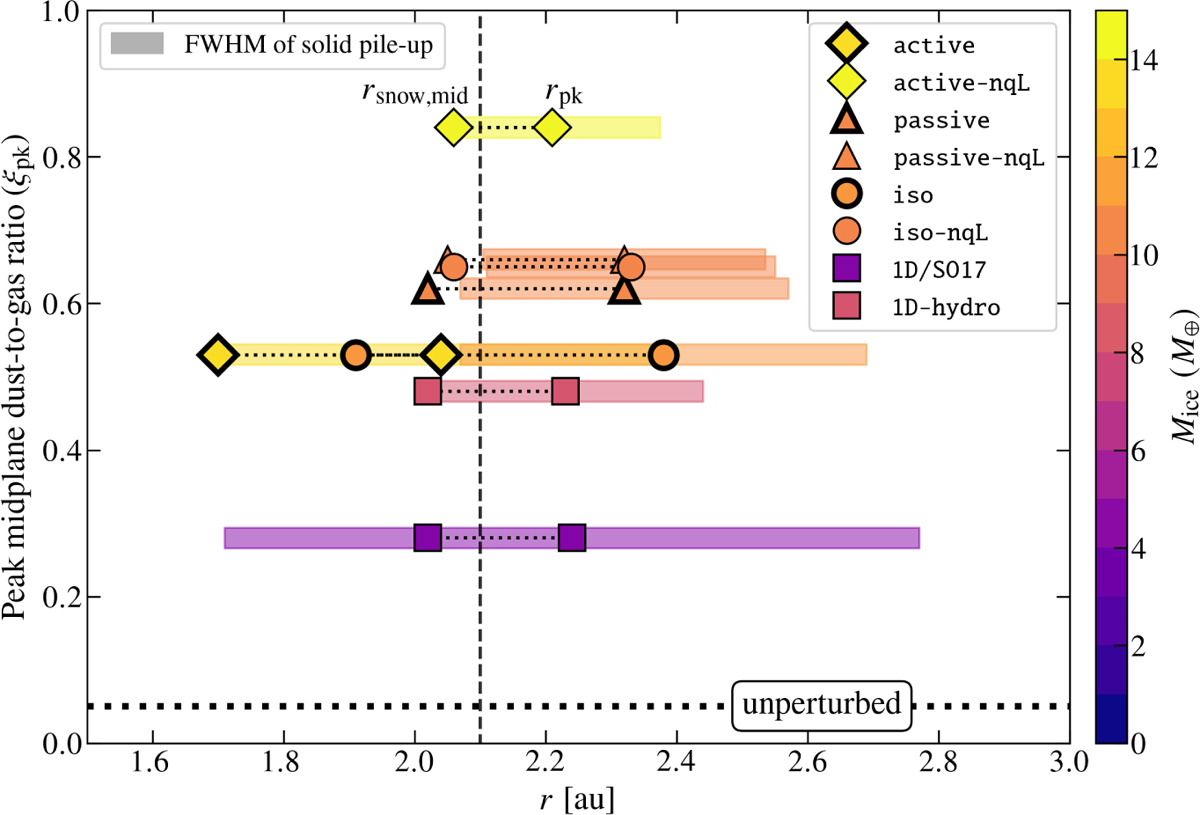
Pile-up properties of 1D and 2D runs as listed in Table 1. For each run, two markers are plotted to indicate the locations of the midplane snowline rsnow,mid (left) and the peak solid-to-gas ratio rpk (right), with their y-axis indicating the value of the peak midplane solid-to-gas ratio ξpk . The vertical dashed line denotes the location of rsnow,mid before pebble injection (2.1 au). The horizontal dotted line, labeled as “unperturbed”, denotes the expected solid-to-gas ratio at the snowline without ice sublimation. The length of the shaded region, centered on rpk , denotes the FWHM of the pile-up. The color represents the total amount of water mass stored, as ice, in the snowline region.
Current usage metrics show cumulative count of Article Views (full-text article views including HTML views, PDF and ePub downloads, according to the available data) and Abstracts Views on Vision4Press platform.
Data correspond to usage on the plateform after 2015. The current usage metrics is available 48-96 hours after online publication and is updated daily on week days.
Initial download of the metrics may take a while.