Fig. 8
Download original image
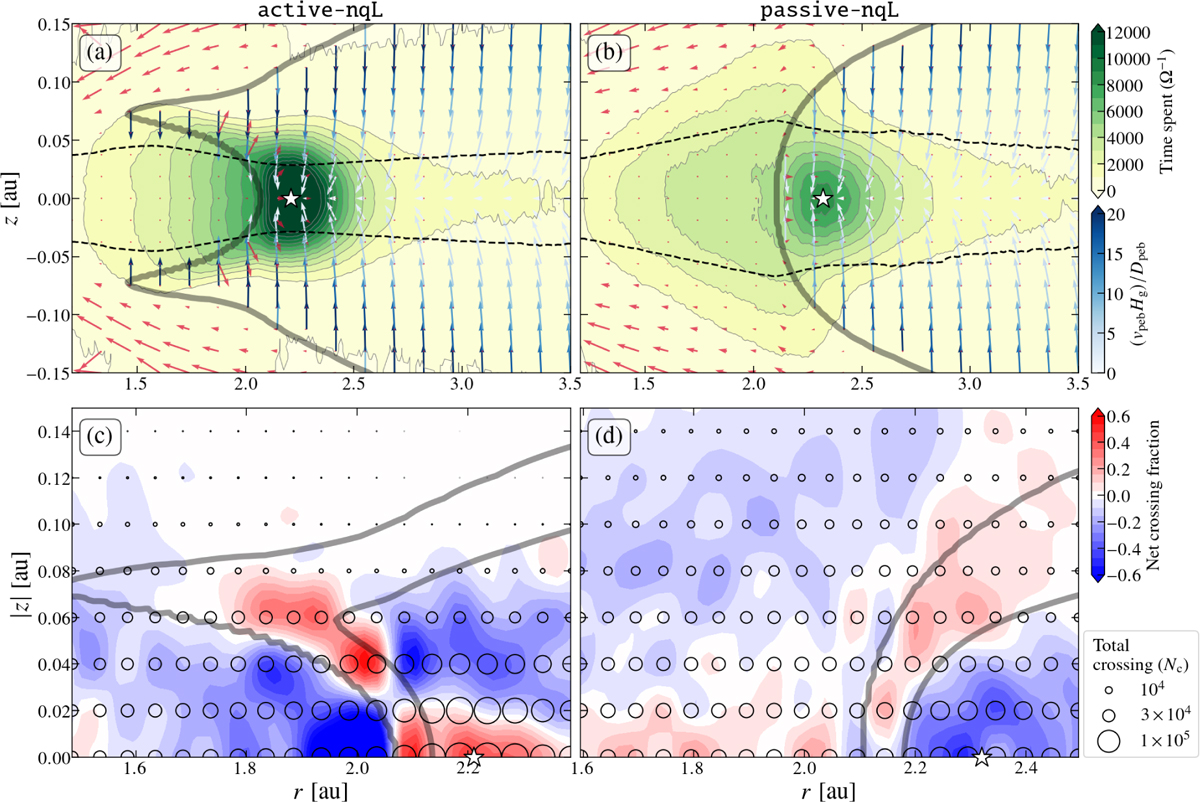
Upper panels: summary of the Lagrangian trajectory integration in the active-nqL and passive-nqL disks. Yellow-green color shading denotes the total time spent in each grid cell by the water particles, which are released from the outer boundary. The black dashed lines denote the root-mean-square of the positions of particles in the vertical direction. The stars denote rpk of different runs (Table 1). The thick grey lines represents the location where ρp,ice/ρvap = 1 and 10−3, respectively, depicting the regions where particles are mostly in ice or vapor phase, respectively (see Appendix A for detailed explanation). The blue and red arrows represent the velocity of ice and vapor, respectively. The length of the arrows is proportional to vHg /D (D, v are the diffusivity and velocity of gas or pebble), respectively, which represent the ratio of the diffusion and advection timescales, ![]() . We limit the length of the arrows so that so that vHg/D ≤ 3 for visualization purposes. Also, the depth of color of blue arrows represents tdif,peb/tadv,peb. Lower panels: crossing frequency of Lagrangian particles at various altitudes along the radial direction. Circles are plotted at the center of each vertical interval, with their surface area proportional to the total number of crossings (Nc). Color indicates the ratio of net crossings to the total particle number (Nnet/Np). Here, negative (blue) values denote net accretion, whereas positive (red) values denote net outflow. The domain is zoomed-in to focus on the snowline region. The checkerboard pattern in the net crossing fraction around the snowline seen in the active-nqL run is a manifestation of vigorous water cycling.
. We limit the length of the arrows so that so that vHg/D ≤ 3 for visualization purposes. Also, the depth of color of blue arrows represents tdif,peb/tadv,peb. Lower panels: crossing frequency of Lagrangian particles at various altitudes along the radial direction. Circles are plotted at the center of each vertical interval, with their surface area proportional to the total number of crossings (Nc). Color indicates the ratio of net crossings to the total particle number (Nnet/Np). Here, negative (blue) values denote net accretion, whereas positive (red) values denote net outflow. The domain is zoomed-in to focus on the snowline region. The checkerboard pattern in the net crossing fraction around the snowline seen in the active-nqL run is a manifestation of vigorous water cycling.
Current usage metrics show cumulative count of Article Views (full-text article views including HTML views, PDF and ePub downloads, according to the available data) and Abstracts Views on Vision4Press platform.
Data correspond to usage on the plateform after 2015. The current usage metrics is available 48-96 hours after online publication and is updated daily on week days.
Initial download of the metrics may take a while.