Fig. 7
Download original image
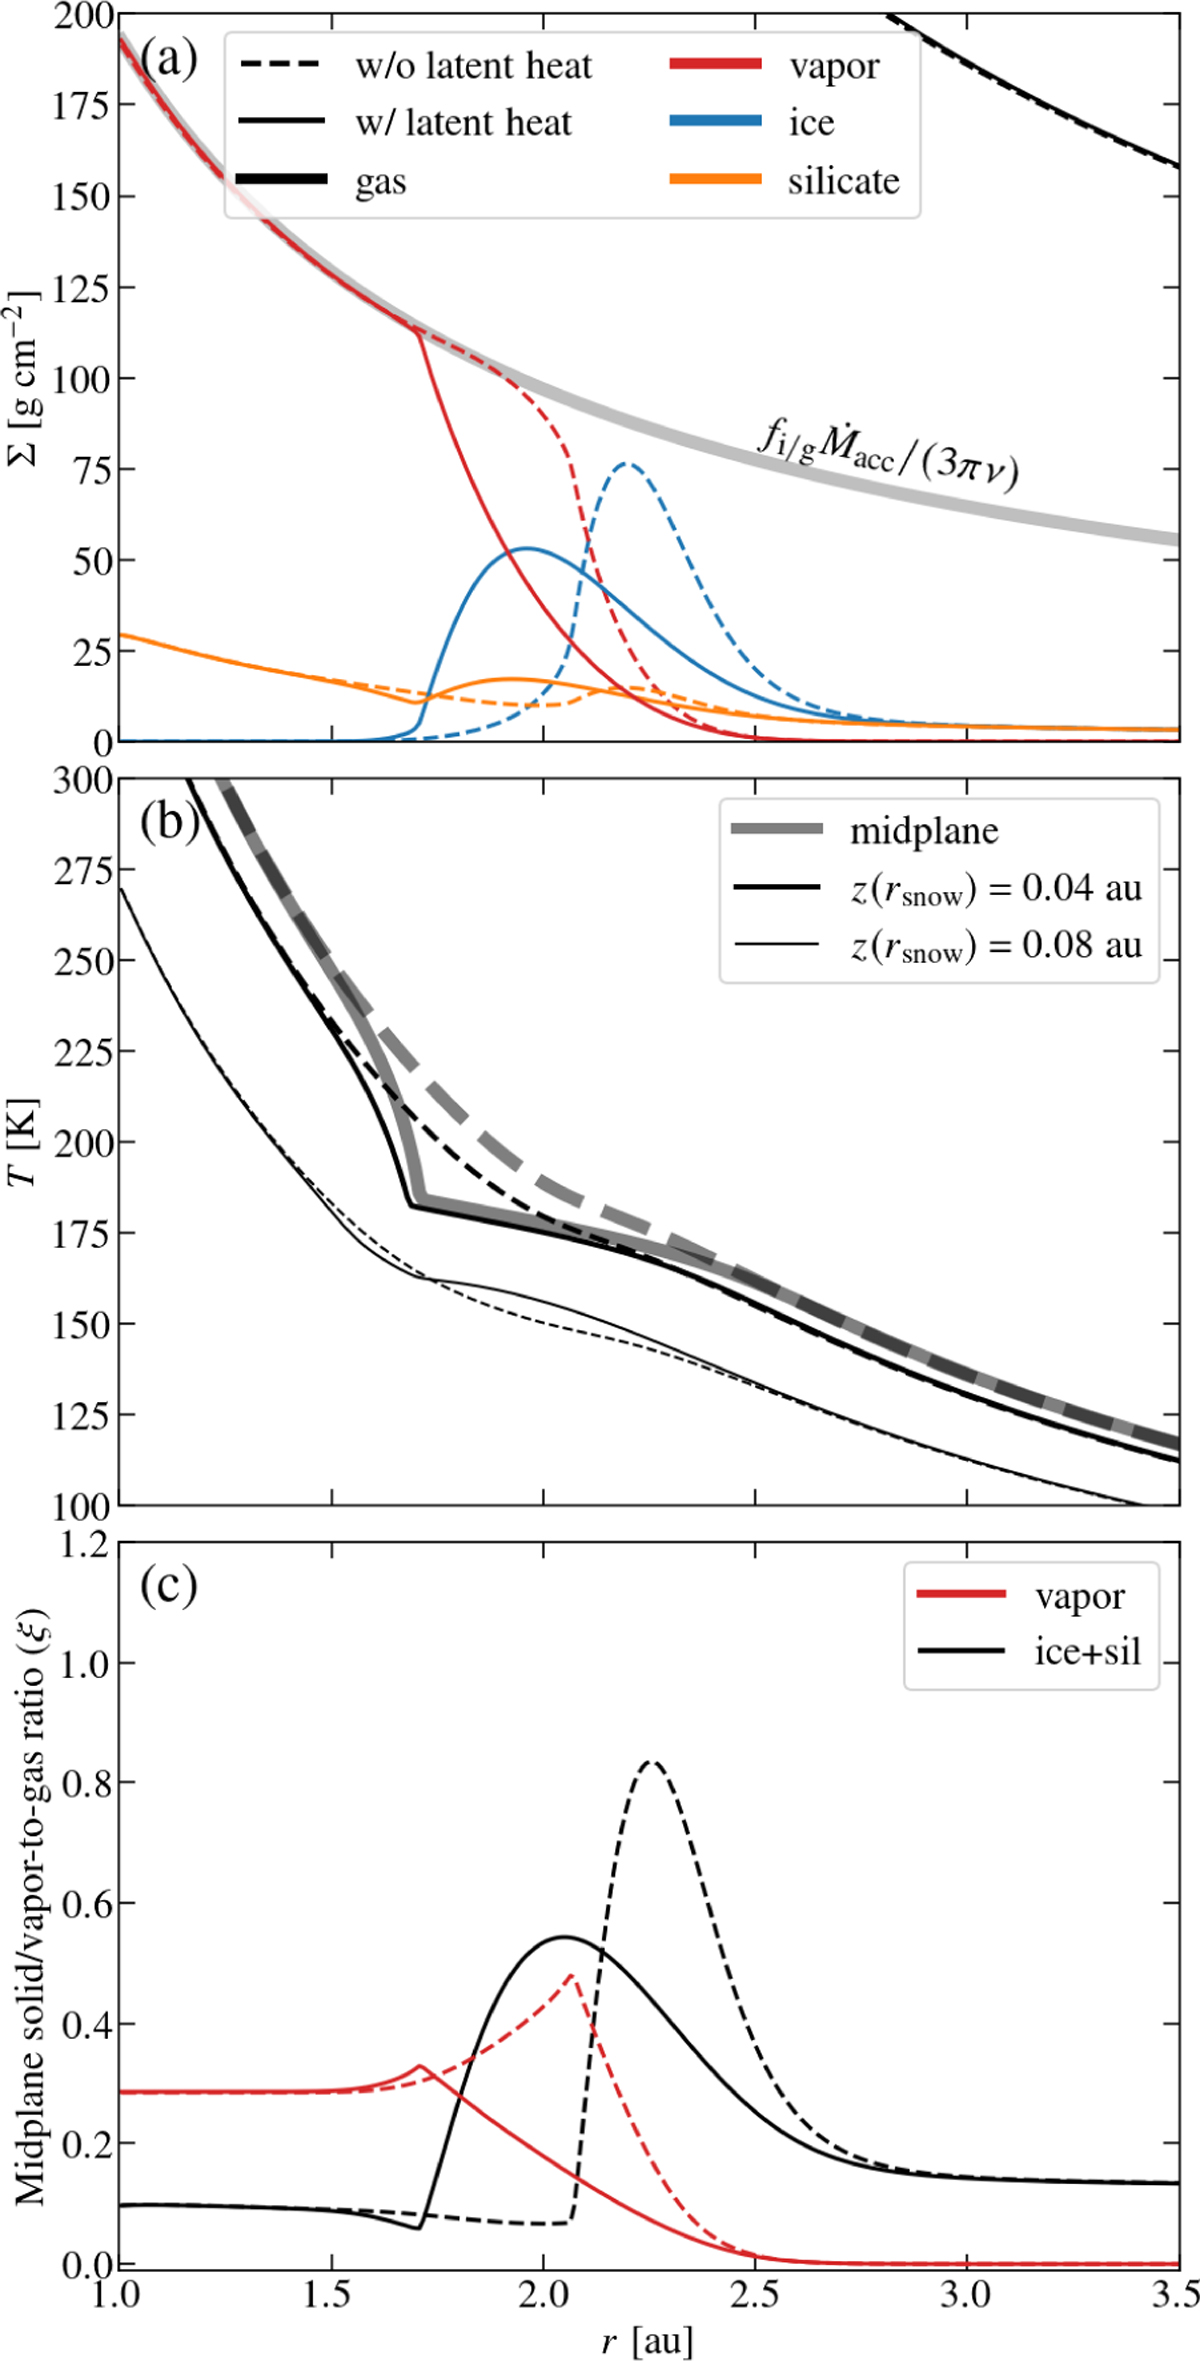
Comparisons of radial profiles of the active disks. For all three panels, the solid line represents the active disk while the dashed line represents active-nqL disk. (a) The surface density profiles. As in Fig. 4, the expected vapor surface density fi/g Ṁacc /(3πν) is plotted in grey. (b) The temperature profile of slices in θ-direction at the midplane and higher altitudes. The slices above the midplane pass through a certain height ɀ at the location of snowline (rsnow) of the active run. (c) The solid-to-gas ratio (black) and vapor-to-gas ratio (red) at the midplane in steady state.
Current usage metrics show cumulative count of Article Views (full-text article views including HTML views, PDF and ePub downloads, according to the available data) and Abstracts Views on Vision4Press platform.
Data correspond to usage on the plateform after 2015. The current usage metrics is available 48-96 hours after online publication and is updated daily on week days.
Initial download of the metrics may take a while.