Fig. 6
Download original image
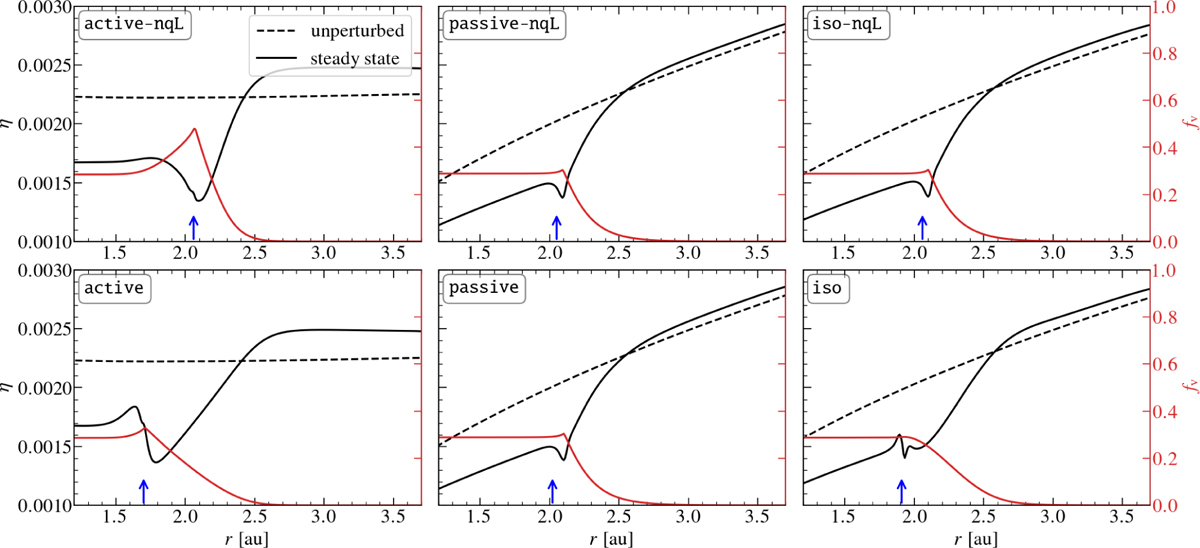
Azimuthal velocity deviation at the midplane , expressed in terms of the radial pressure gradient parameter η (Equation (35)). The black dashed and solid lines show η before vapor injection and after the steady state is reached, respectively. The red lines show the vapor fraction corresponding to the y-axis on the right. The blue arrows indicate the position of the midplane snowline (rsnow,mid). A reduction of η at the snowline region strengthens solid pileups and is conducive to planetesimal formation by streaming instability and planet formation by pebble accretion.
Current usage metrics show cumulative count of Article Views (full-text article views including HTML views, PDF and ePub downloads, according to the available data) and Abstracts Views on Vision4Press platform.
Data correspond to usage on the plateform after 2015. The current usage metrics is available 48-96 hours after online publication and is updated daily on week days.
Initial download of the metrics may take a while.