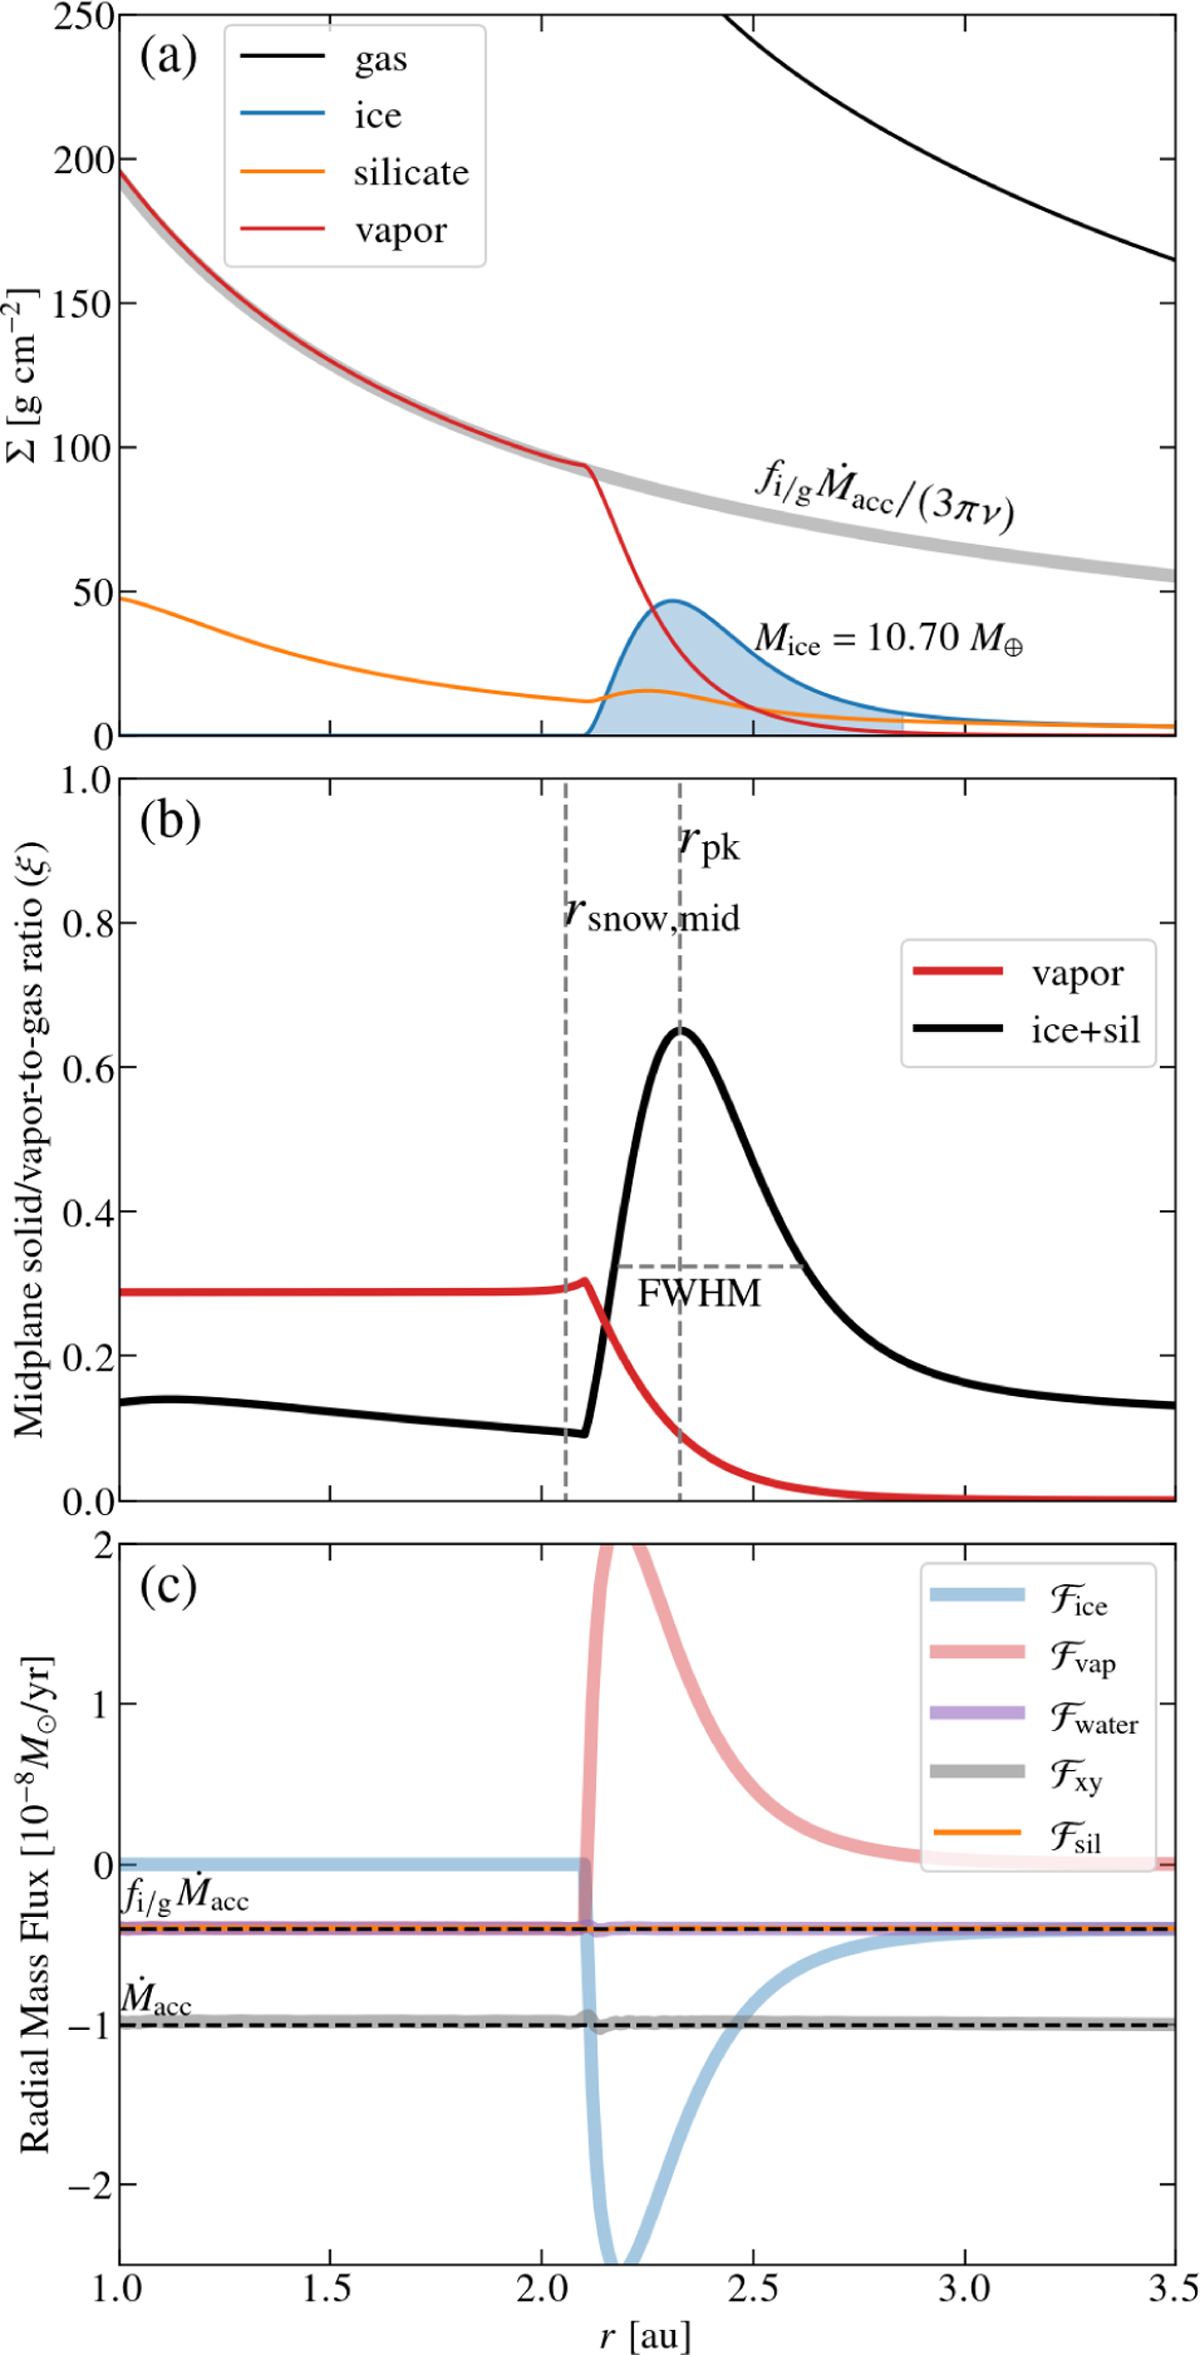
Fig. 4
Download original image
Radial profiles of the passive run. (a): vertically-integrated surface density of total gas, ice, silicate and vapor. The grey line shows the expected vapor surface density from the unperturbed viscous solution (Equation (2)), where fi/g is the ice-to-gas flux ratio. The blue shade denotes the region that contains Mice. (b): the solid/vapor-to-gas ratio in the midplane. The positions of peak solid-to-gas ratio (rpk) and the midplane snowline (rsnow,mid) are highlighted; (c): vertically- integrated radial mass fluxes of ice, vapor, water, H-He and silicate, where ℱwater = ℱvap + ℱice. The dashed lines denote the imposed gas (Ṁacc) and ice ( fi/g Ṁacc) fluxes, respectively.
Current usage metrics show cumulative count of Article Views (full-text article views including HTML views, PDF and ePub downloads, according to the available data) and Abstracts Views on Vision4Press platform.
Data correspond to usage on the plateform after 2015. The current usage metrics is available 48-96 hours after online publication and is updated daily on week days.
Initial download of the metrics may take a while.