Fig. 3
Download original image
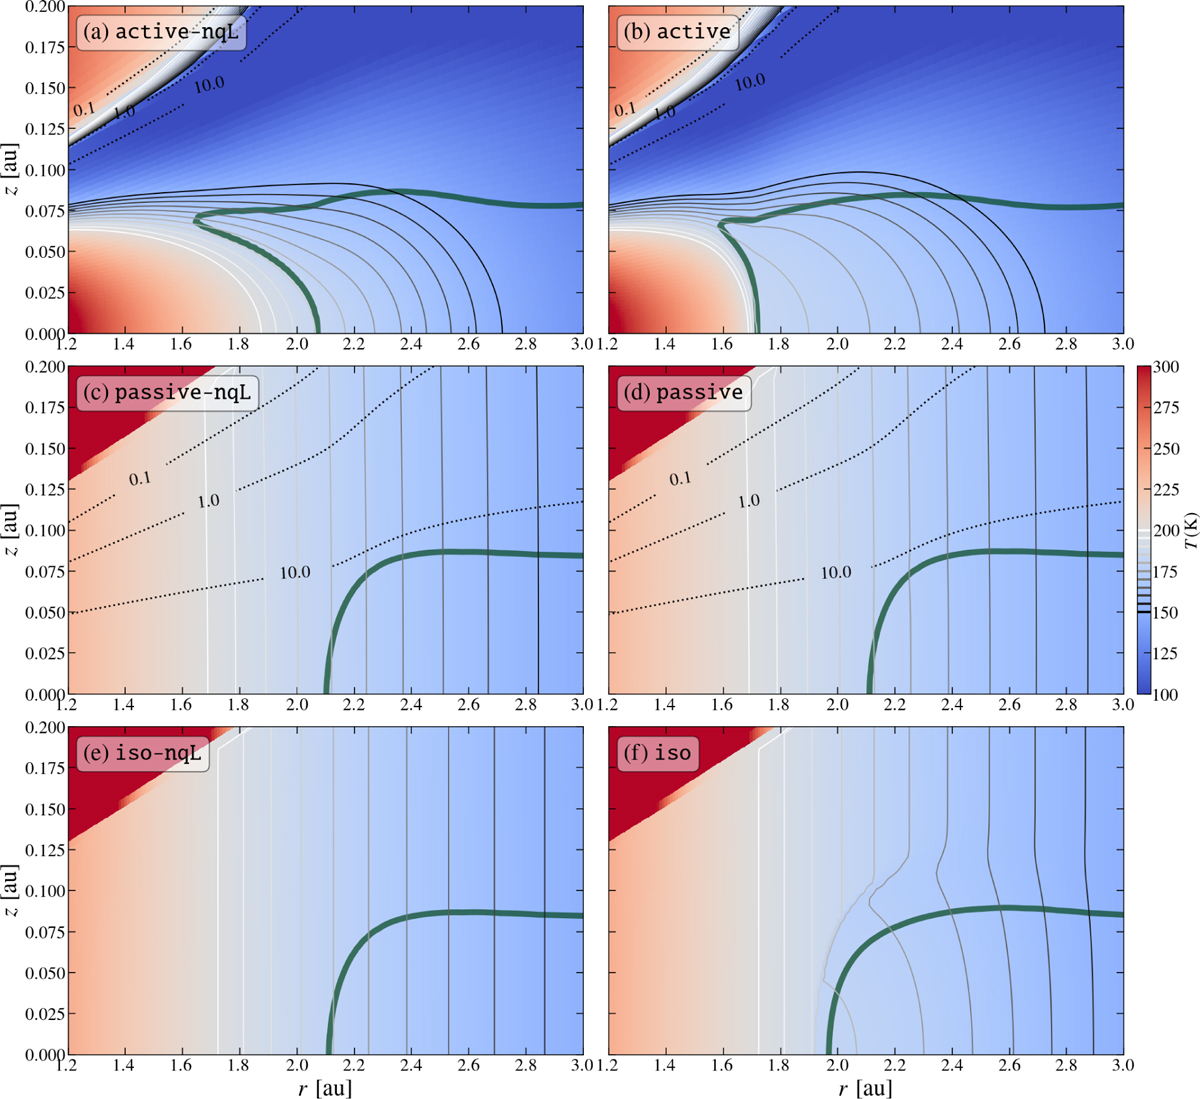
Steady state temperature structure of all the simulation runs (Table 1). The color shows the temperature structure with contours highlighting the range between 150 and 200 K in increments of 5 K. The dashed lines show the Rosseland mean optical depth τR from 0.1 to 10.0, displaying the optically-thick or optically thin nature of the cooling. In panel (e) and (f), the dashed lines are absent since the disk is very optically thin.
Current usage metrics show cumulative count of Article Views (full-text article views including HTML views, PDF and ePub downloads, according to the available data) and Abstracts Views on Vision4Press platform.
Data correspond to usage on the plateform after 2015. The current usage metrics is available 48-96 hours after online publication and is updated daily on week days.
Initial download of the metrics may take a while.