Fig. 2
Download original image
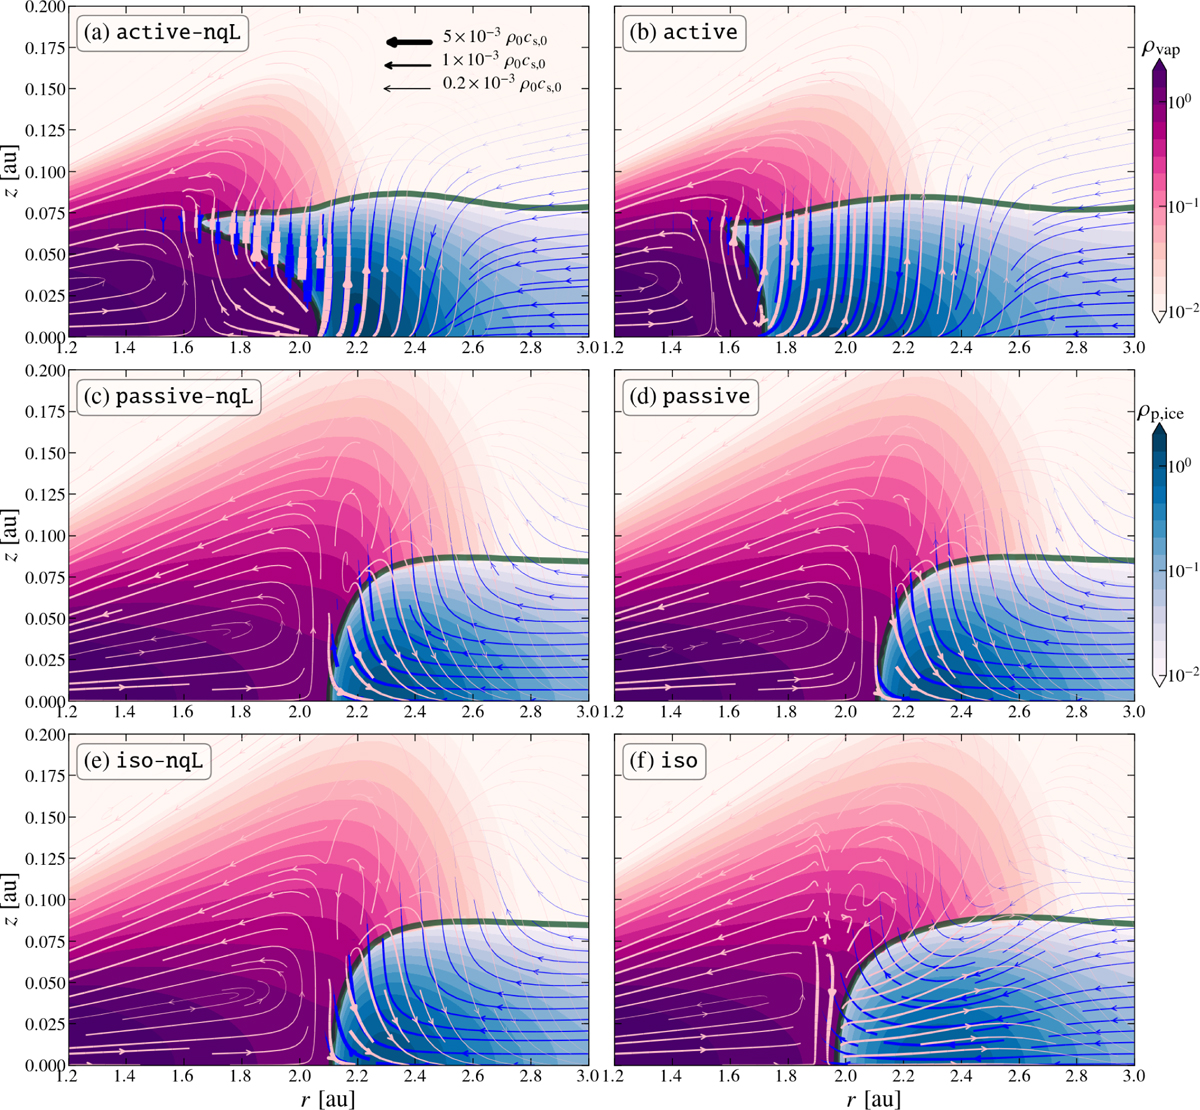
Steady state density structure of all simulated disk (as listed in Table 1). The dark green line denotes the boundary where ρp,ice/ρg = 10−2. The region enclosed by the green line filled with blue shading represents the ice density normalized to ρ0 ≈ 3.4 × 10⁻¹¹ cm g−3 (the midplane gas density at r0 of the unperturbed disk), while the region interior to the snowline indicates the vapor density with red shading. The ice (blue) and vapor (pink) mass fluxes are plotted with streamlines, whose thickness denotes the magnitude of the flux normalized to ρ0cs,0. The mass flows in the vertical direction, which are especially vigorous in the active-nqL and active runs, contribute towards an increased pile-up of ice in the snowline region.
Current usage metrics show cumulative count of Article Views (full-text article views including HTML views, PDF and ePub downloads, according to the available data) and Abstracts Views on Vision4Press platform.
Data correspond to usage on the plateform after 2015. The current usage metrics is available 48-96 hours after online publication and is updated daily on week days.
Initial download of the metrics may take a while.