Fig. 1
Download original image
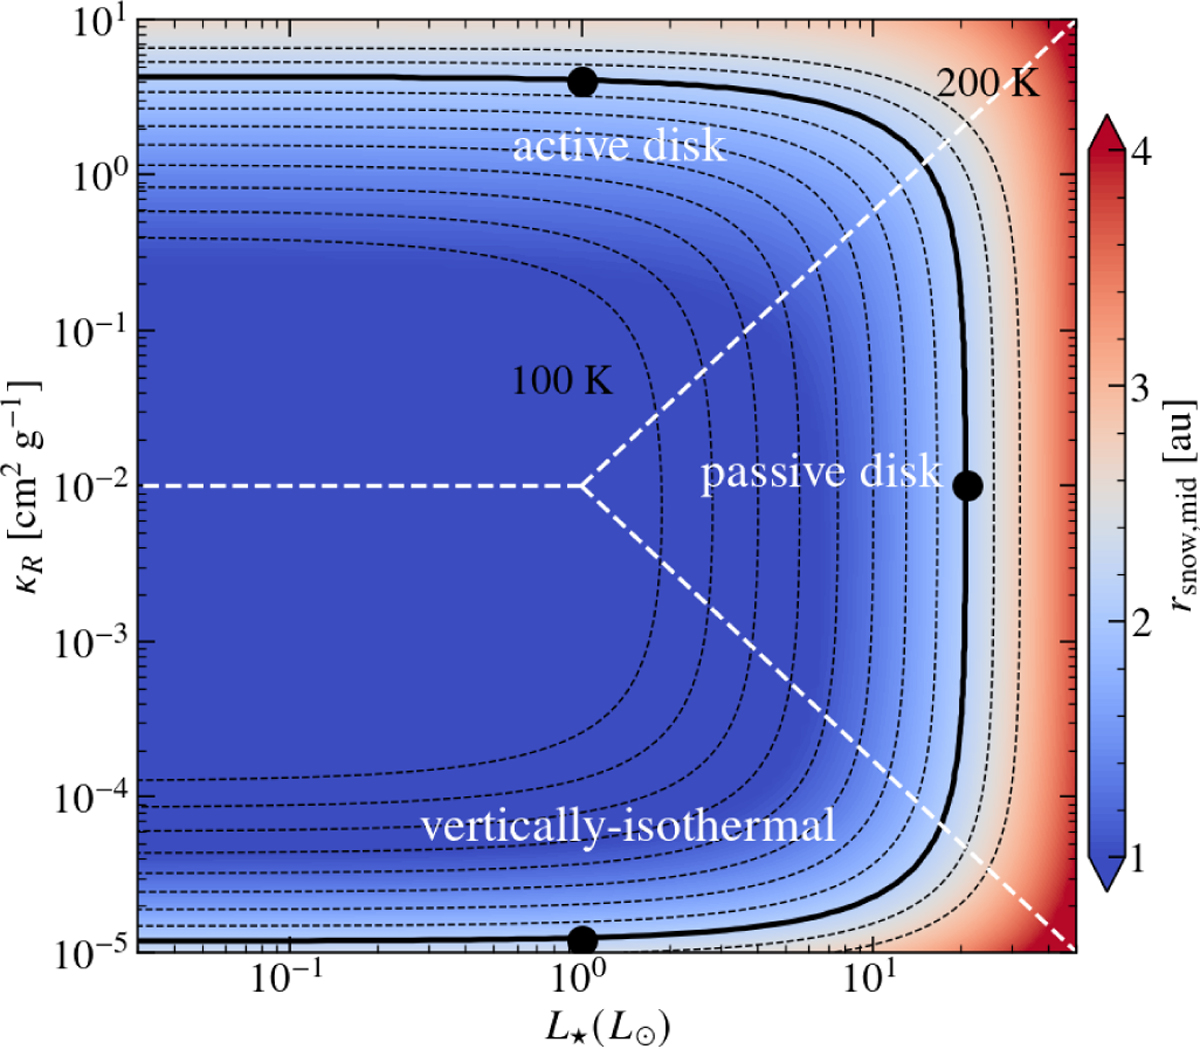
Initial midplane snowline location resulting from the two-stream radiation transport model (Equation (29)) as function of Rosseland mean opacity κR and stellar luminosity L⋆ . Here the optical opacity is fixed to κvi = 10 cm2g−1. The permitted parameter space is divided into three regimes (white dashed lines, for illustration purpose only): “passive disk” when L⋆ is high, “active disk” when κR is high and “vertically-isothermal” disk when κR is small. The dotted lines are temperature contours of the midplane at 2.1 au, ranging from 100 K to 200 K in 10 K increments. The black solid line represents the parameter combinations that lead to rsnow,mid = 2.1 au and the black dots denote the parameter combinations used in this work, as summarized in Table 1. Hydrodynamic and thermodynamic effects will move the snowline location in the simulation.
Current usage metrics show cumulative count of Article Views (full-text article views including HTML views, PDF and ePub downloads, according to the available data) and Abstracts Views on Vision4Press platform.
Data correspond to usage on the plateform after 2015. The current usage metrics is available 48-96 hours after online publication and is updated daily on week days.
Initial download of the metrics may take a while.