Fig. 9
Download original image
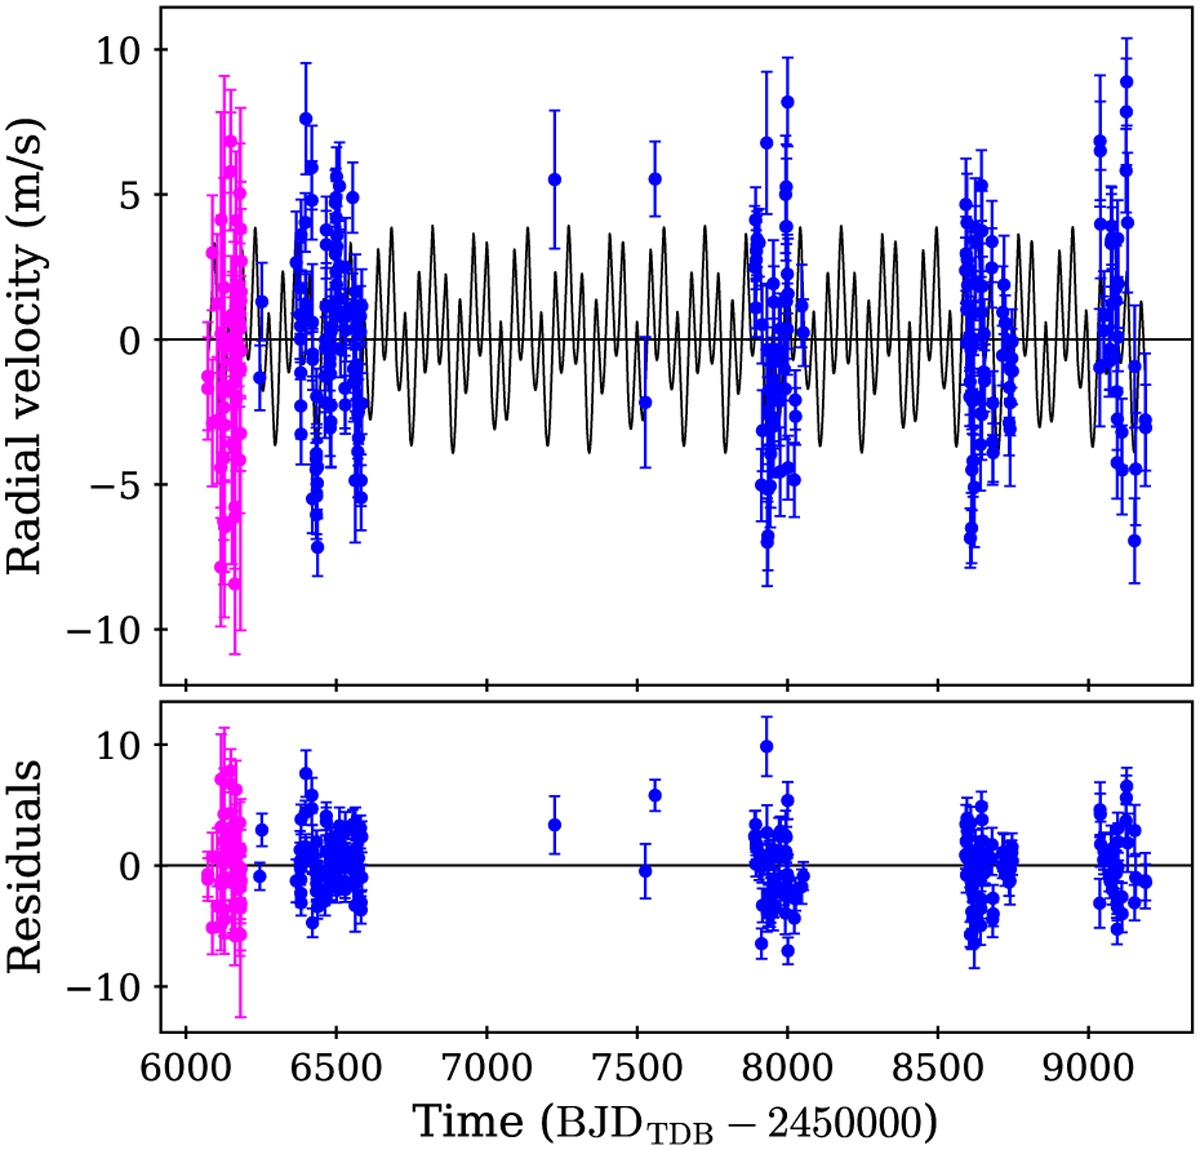
Kepler-10 RVs from the TRADES analysis after subtracting the signal of Kepler-10 b. Top panel: observed RVs (removed RV offset for each dataset) as colored circles (magenta for HN-1 and blue for HN 2), and the TRADES best-fit model (black line). Bottom panel: residuals between the observed RVs and simulated ones with TRADES.
Current usage metrics show cumulative count of Article Views (full-text article views including HTML views, PDF and ePub downloads, according to the available data) and Abstracts Views on Vision4Press platform.
Data correspond to usage on the plateform after 2015. The current usage metrics is available 48-96 hours after online publication and is updated daily on week days.
Initial download of the metrics may take a while.